

The price of the official Trump coin continues to decline on Friday, extending the correction for the second consecutive week.
Santiment data shows that some large whales are reducing their exposure to TRUMP tokens, fueling selling pressure.
Derivative data and technical outlook show a bearish bias, indicating that the meme coin may head towards its lowest levels since the beginning of the year.
The price of the official Trump coin ($TRUMP ) remains under pressure, trading below $3.05 at the time of writing on Friday amid bearish sentiment. The fading confidence of whales, weak derivatives data, and deteriorating technical structure suggest that the meme coin may correct further, potentially marking a new annual low.
Declining exposure of whales.
Data from Santiment's supply distribution supports the bearish technical outlook for the official Trump coin, as the number of large wallet holders, known as whales, decreases their exposure.
The indicators show that whales holding between 100,000 and 1 million tokens (the red line in the chart below) and between 10 million and 100 million tokens (the blue line) have disposed of a total of 16.31 trillion tokens since March 14. During the same period, whales holding between 1 million and 10 million tokens (the yellow line) have accumulated 15.33 trillion TRUMP tokens. This indicates a shift in large wallet positioning, with some major whales reducing their exposure. In contrast, medium-sized whales are absorbing some supply, often reflecting distribution at higher levels and adding to the near-term bearish risks for the official Trump coin.
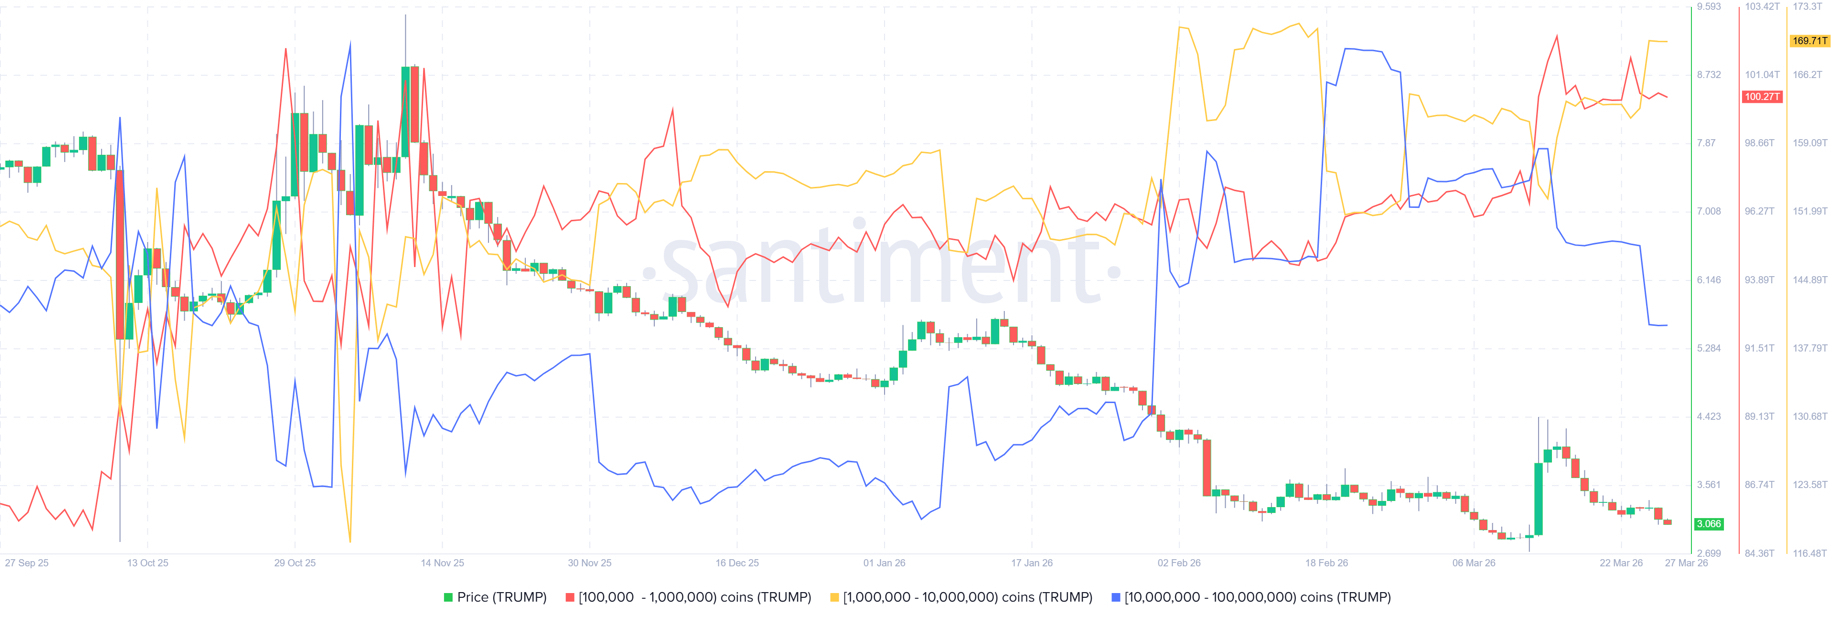
Chart of TRUMP supply distribution. Source: Santiment
Derivatives data show a decline in investor interest.
In terms of derivatives, the indicators show a bearish bias. Open interest (OI) for the $TRUMP futures contracts on Binance declined to $39.22 million on Friday and has been in a continuous decline since mid-March. This drop in open interest reflects a decrease in investor participation.
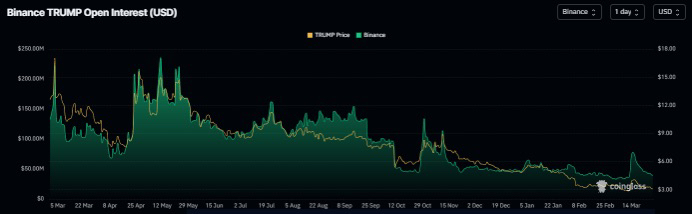
Chart of open interest for TRUMP contracts on Binance. Source: Coinglass
Additionally, the long-to-short ratio for TRUMP on CoinGlass, which currently stands at 0.71 on Friday, is the lowest in over a month. This ratio, which is below one, reflects bearish sentiment in the markets, as more traders bet on a decline in the asset's price.
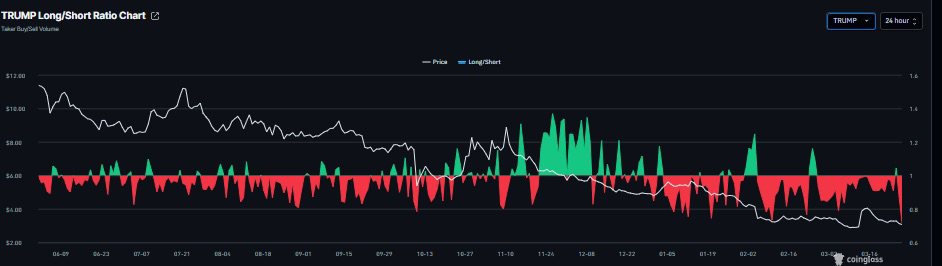
Chart of the long-to-short ratio for TRUMP. Source: Coinglass
Technical outlook: TRUMP is heading towards the lowest level since the beginning of the year.
The official $TRUMP coin continues to correct, trading below $3.05 at the time of writing on Friday, continuing a two-week streak of declines.
If TRUMP continues its downward trend, the decline may extend towards the lowest level since the beginning of the year at $2.70. Closing below this level could expand losses towards the key psychological level at $2, potentially marking a new annual low.
The Relative Strength Index (RSI) reads 38 on the daily chart, which is below the neutral level of 50 and trending downwards, indicating the accumulation of bearish momentum. Furthermore, the Moving Average Convergence Divergence (MACD) showed a bearish crossover last week, which still stands, with rising red histogram bars, supporting the negative outlook.
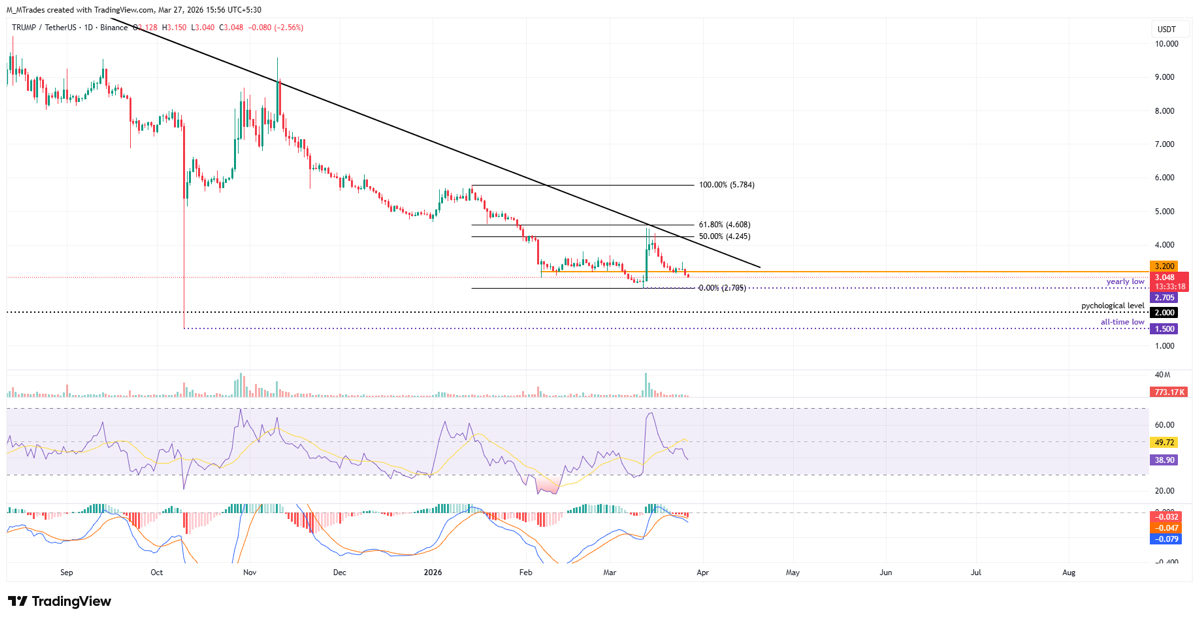
Daily chart for the TRUMP/USDT pair.
On the contrary, if TRUMP recovers, the rise may extend towards the daily resistance level at $3.20.