


The price of Bitcoin falls for the second consecutive day amid the impact of risk aversion sentiments and outflows from ETFs.
Ethereum is struggling to maintain the $2000 level as immediate support amid a deteriorating technical structure.
Ripple XRP is testing the lower end of a tight range despite a slight improvement in retail risk appetite, with open interest in futures at $2.65 billion.
The cryptocurrency market extends its broad correction on Friday, as Bitcoin ($BTC ) fell below $68,000, affected by risk-off sentiment and volatility amid the war in the Middle East.
Altcoins, including Ethereum ($ETH ) and Ripple ($XRP ), are retreating alongside Bitcoin, reflecting a lack of investor confidence in the crypto market. The largest smart contract currency, Ethereum, hovers above $2,000 but remains within a defined broader bearish trend, while the remittance currency, Ripple, has dropped below the week's opening at $1.38 to trade around $1.35.
Bitcoin, Ethereum, and Ripple are under pressure as demand fades
Bitcoin faces a noticeable slowdown in institutional interest, as outflows of $171 million from spot ETFs on Thursday confirmed this trend. Risk appetite has remained volatile in 2026 amid a deteriorating macroeconomic outlook, with risk-off sentiment continuing.
Earlier this month, the Federal Reserve (Fed) took a hawkish stance on interest rate cuts due to the war in Iran. Investors are now pricing in a high likelihood that rates will remain unchanged for much longer in 2026, a significant shift from the previous expectation of at least two cuts.
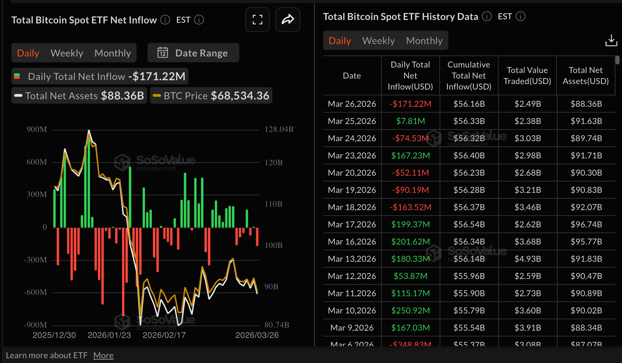
Bitcoin ETF fund flows | Source: SoSoValue
As for Ethereum, spot ETFs have continued their downward trend for seven consecutive days, with outflows nearing $93 million on Thursday. Cumulative inflows now stand at $11.57 billion and net assets under management at $11.7 billion amid ongoing risk-off sentiment. If this bearish outlook persists, it will further dampen sentiment and reduce demand for Ethereum's digital investment products.
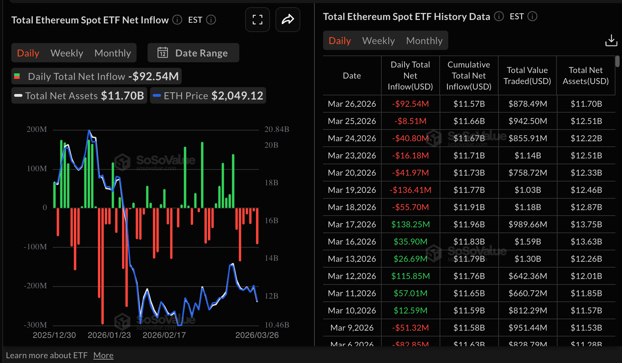
Ethereum ETF fund flows | Source: SoSoValue
At the same time, interest in spot Ripple funds remains low as products closed on Thursday without any inflows. The cumulative inflows average is currently $1.21 billion, with net assets under management averaging $949 million.
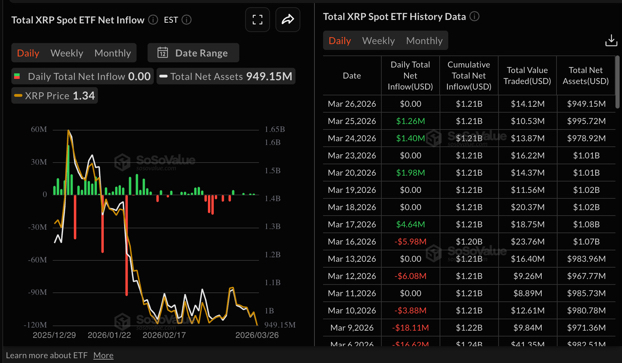
Ripple ETF fund flows | Source: SoSoValue
The derivatives market for XRP shows a slightly positive outlook, with open interest in futures (OI) increasing to $2.65 billion on Friday, up from $2.53 billion the previous day. CoinGlass data shows that open interest has steadily grown from $2.33 billion on Monday, confirming a recovery appetite in the retail market. A continued rise in open interest would support the potential recovery of Ripple.
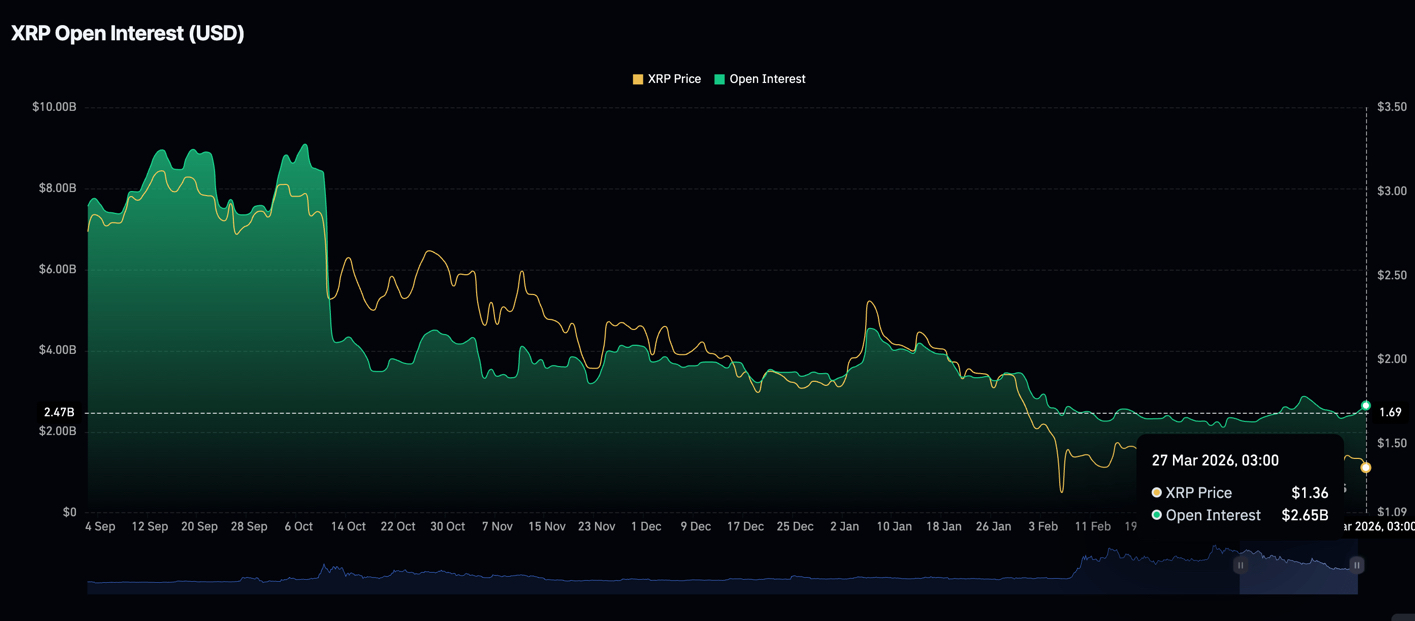
Open interest in Ripple futures | Source: CoinGlass
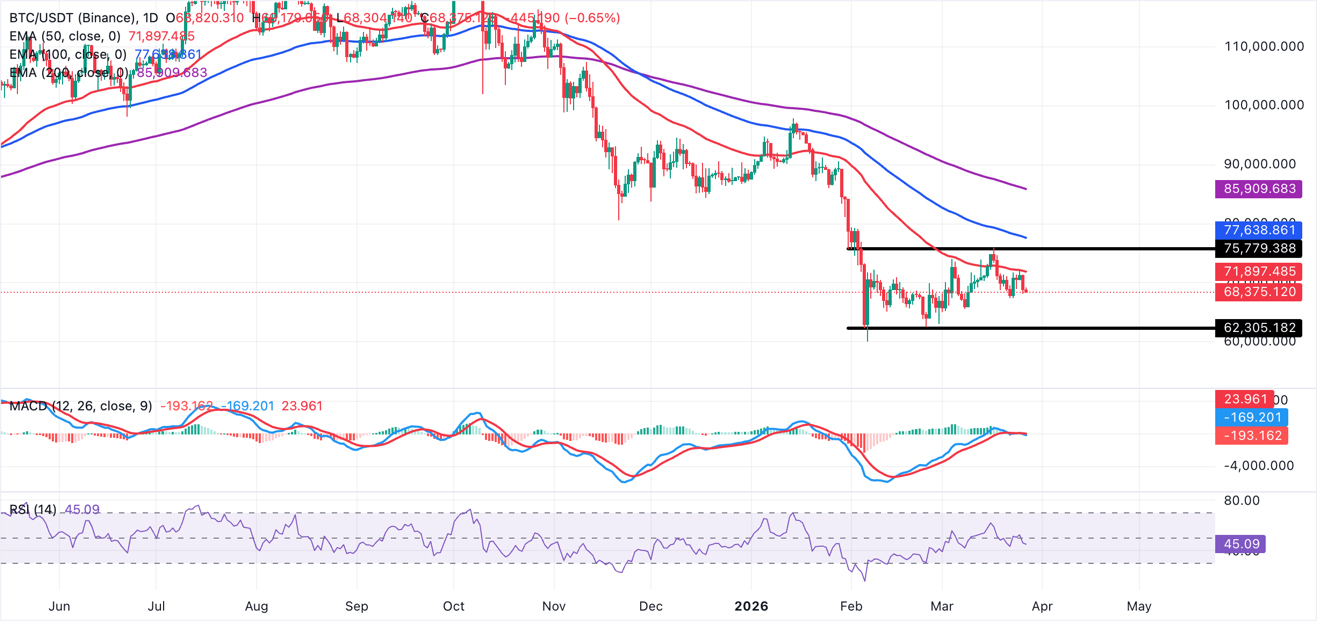
Daily chart: Bitcoin declines as technical indicators retreat
Bitcoin's price is trending down below $68,000 at the time of writing this report on Friday. The near-term bias remains neutral to bearish, with a tendency to decline as the price swings below the aggregated 50-day, 100-day, and 200-day exponential moving averages, all of which are above the spot price and create an overall framework for a corrective expectation.
The Moving Average Convergence Divergence (MACD) has dropped below the signal line on the daily chart, with the expansion of red histogram bars indicating that sellers maintain moderate momentum after Bitcoin's failure to stay above the $70,000 barrier. At the same time, the Relative Strength Index (RSI) around 45 reinforces this view with fading bullish pressure without reaching oversold conditions, which aligns with a consolidation phase rather than a strong bearish trend.
Daily chart of ETH/USDT
The initial resistance is around the pivotal level of $70,000, with a break above revealing the 50-day exponential moving average at $71,897, where previous peaks converge with a set of declining short-term moving averages. On the downside, immediate support is seen around $67,500, which is the recent lowest close before the current rebound, followed by $65,000, where previous reaction lows and the lower end of the latest range are clustered. A daily close below $65,000 would open the door for a deeper retracement towards the annual low at $60,000.
Technical outlook for altcoins: Ethereum and XRP sellers tighten their grip
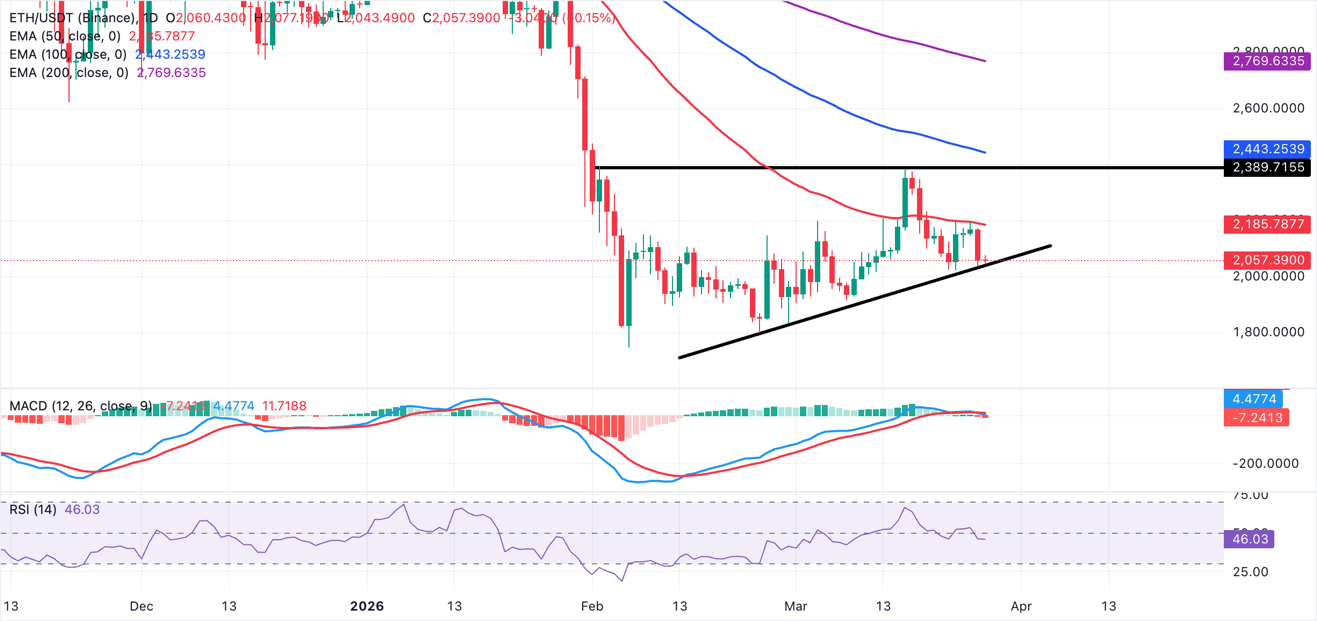
Ethereum is under pressure, trading near support at $2,000. The near-term bias is cautiously bearish as the price remains below the ascending trend line, which still holds. The 50-day exponential moving average near $2,185 and the 100-day exponential moving average at around $2,443 limit Ethereum's rise, placing the token within a wider corrective trend.
Furthermore, the MACD has dropped below the signal line on the daily chart, with the expansion of red histogram bars indicating fading bullish momentum and reinforcing the downward bias. The Relative Strength Index (RSI) remains at 46 below the midpoint of 50 on the same chart, which aligns with light selling pressure rather than complete capitulation.
Daily chart of ETH/USDT
Immediate support is near the recent low of $2,000, with a break revealing a deeper demand area around $1,950 if sellers continue to dominate. Below that, the area at $1,800 appears as the next downside level where previous reaction lows cluster. On the upside, Ethereum faces resistance at the 50-day exponential moving average around $2,185, which needs to be reclaimed with a daily close to alleviate the current pressure.
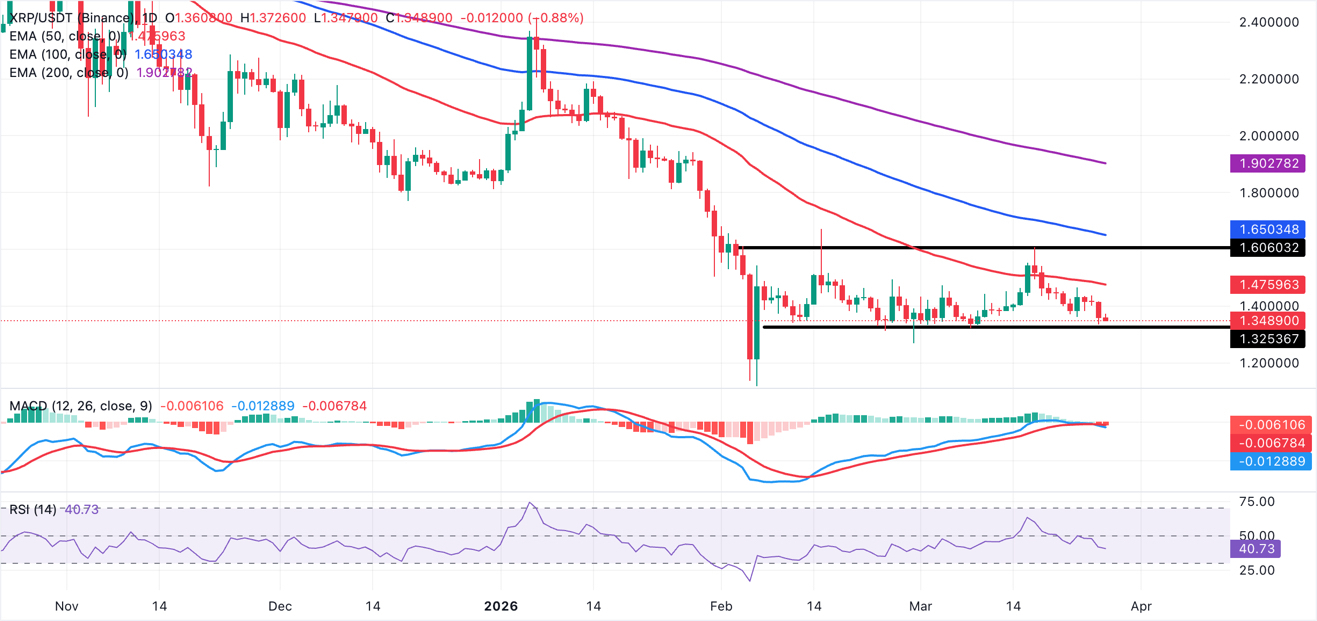
As for XRP, the near-term bias remains moderately bearish as the price continues to retrace to around $1.35, below the 50-day, 100-day, and 200-day exponential moving averages, maintaining a broader bearish trend despite the earlier rise towards $1.61. The MACD has fallen below the signal line on the daily chart as the red histogram bars expand, reflecting the fading bullish momentum after the recent advance and reinforcing bearish pressure.
At the same time, the Relative Strength Index (RSI) hovers just above 40 on the same chart, indicating bearish momentum without oversold conditions and leaving room for further weakness if sellers continue to dominate.
Daily chart of ETH/USDT
Immediate support for XRP is at $1.32, aligning with the March 8 low. A break below this demand will reveal the next bearish area near $1.30, before stronger demand around $1.25. On the upside, initial resistance stands at $1.40, where the recent rebound halted, followed by $1.45, which constrained the price in mid-March. A daily close above $1.45 would alleviate the current bearish tone and open the way towards $1.54.