

Solana is fluctuating around $86 on Friday after a nearly 6% drop the previous day, weighing on a short-term support line.
Exchange-traded funds in Solana in the United States recorded outflows exceeding one million dollars on Thursday, in line with the spot market correction.
Derivatives data shows an increase in open interest amid negative funding rates and a long-to-short ratio of less than 1, indicating selling dominance.
Solana ($SOL ) is trading around $86 at the time of publication on Friday, after a 6% drop the previous day, in line with the broader market correction and outflows of over a million dollars from Solana-focused ETFs. Derivatives data indicates a growing dominance of the sell side as high open interest suggests accumulation of positions amid negative funding rates.
The technical outlook for Solana focuses on the critical short-term support line, as breaching it will reveal a support level at $75.
Derivatives data indicates bearish dominance.
CoinGlass data shows an increase of over 3% in open interest for Solana futures contracts over the past 24 hours, reaching $5.39 billion, indicating a rise in the nominal value of outstanding contracts. However, the negative funding rate of -0.0078 indicates bearish sentiment among traders. Additionally, the long-to-short ratio is below 1 at 0.9223, suggesting a greater number of active bearish positions.
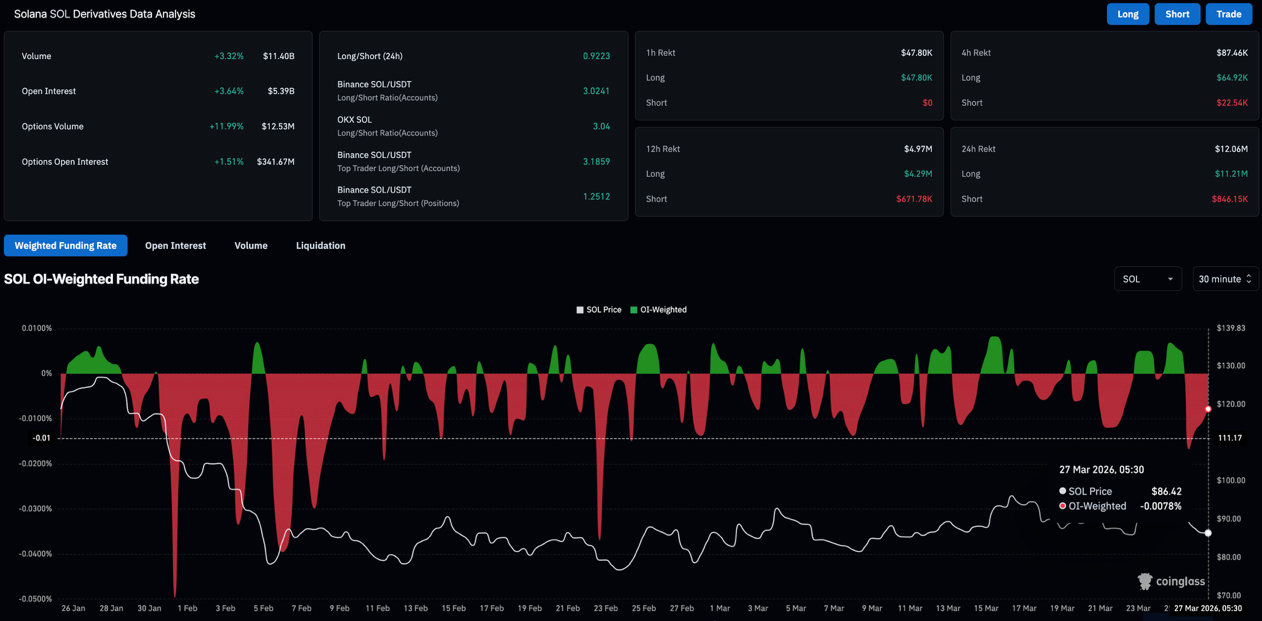
Solana derivatives data. Source: CoinGlass
Overall, the derivatives market indicates a dominance of the sell side among retail traders.
On the institutional side, Solana-focused ETFs recorded outflows of $1.04 million on Thursday, indicating a slight dip in institutional confidence. Extended outflows from ETFs may lead to increased selling in the spot market.
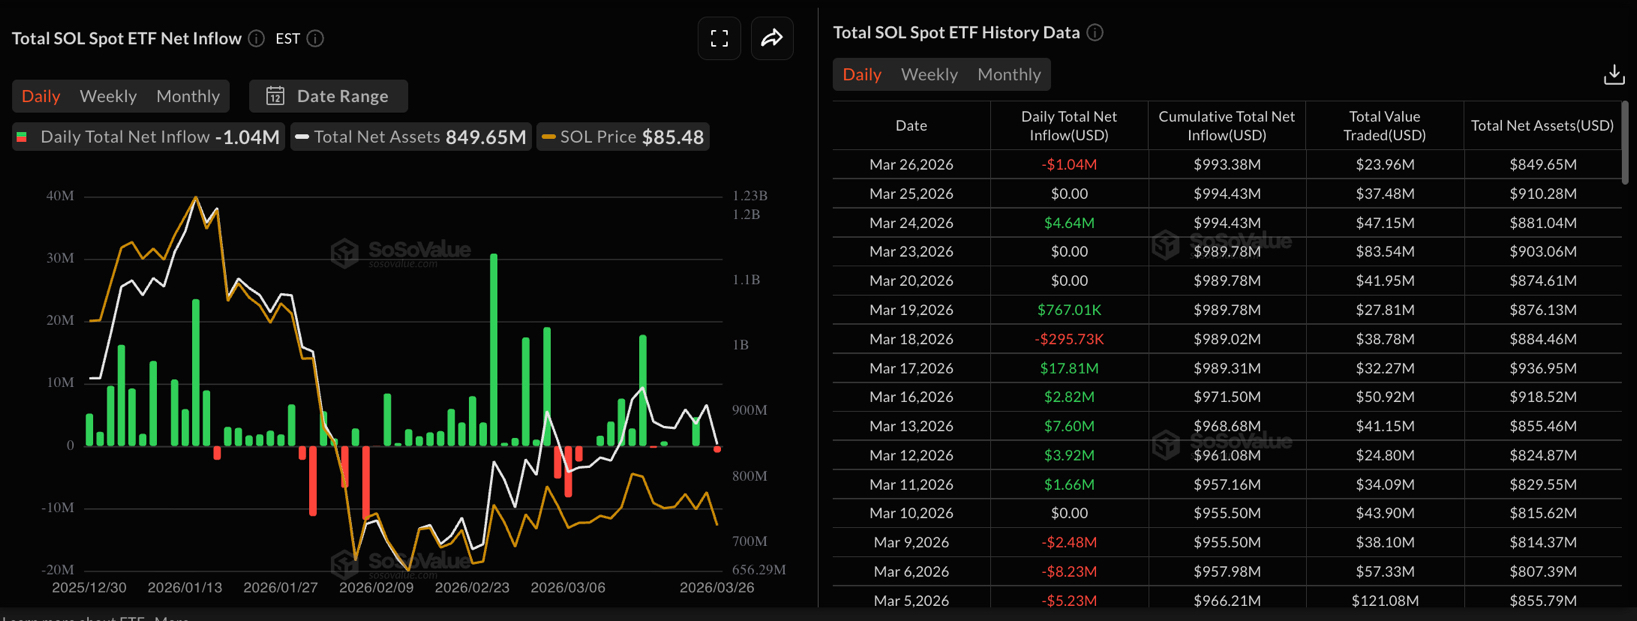
Solana ETF data. Source: Sosovalue
Will Solana's losses extend below $80?
The $SOL fluctuates slightly above $85 at the time of writing this report on Friday, after a decline of nearly 6% the previous day. The short-term bias is slightly bearish as SOL trades below the critical 50, 100, and 200 daily exponential moving averages.
The MACD (Moving Average Convergence Divergence) line has fallen below the signal line, indicating a fading bullish momentum. The Relative Strength Index (RSI) remains at 46 below the midpoint, reinforcing the absence of strong buying pressure.
A critical close below the support line will reveal a drop towards the recent swing low at $75.63, followed by the March 19 low at $67.50.
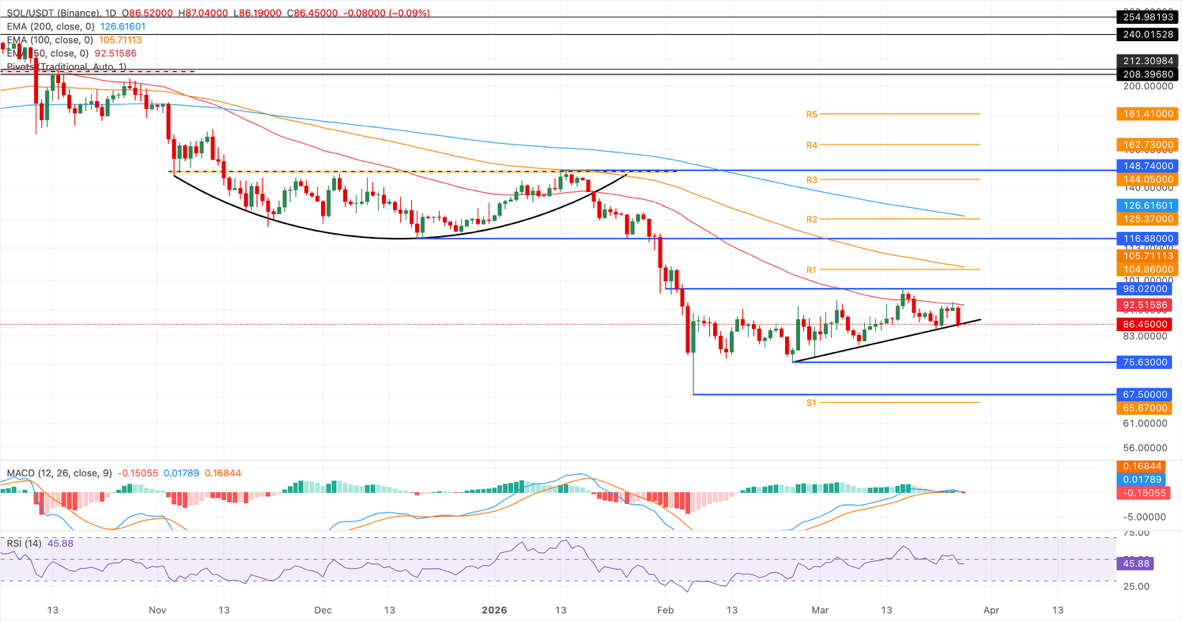
The daily chart for the SOL/USDT price.
On the upside, Solana must reclaim the 50-day exponential moving average at $92.51 to bolster the upward trend.
#solana #sol #BinanceSquare #BinanceSquareFamily #BinanceSquareTalks