Mastering the Downtrend: When to Place a Short Position
Short-selling, or "shorting," is the art of profiting from a decline in an asset's price. While most investors are looking for the next "moon shot," professional traders watch for the cracks in the foundation. Last week’s price action in both crypto and equities provided a masterclass in identifying these high-probability "sell" signals.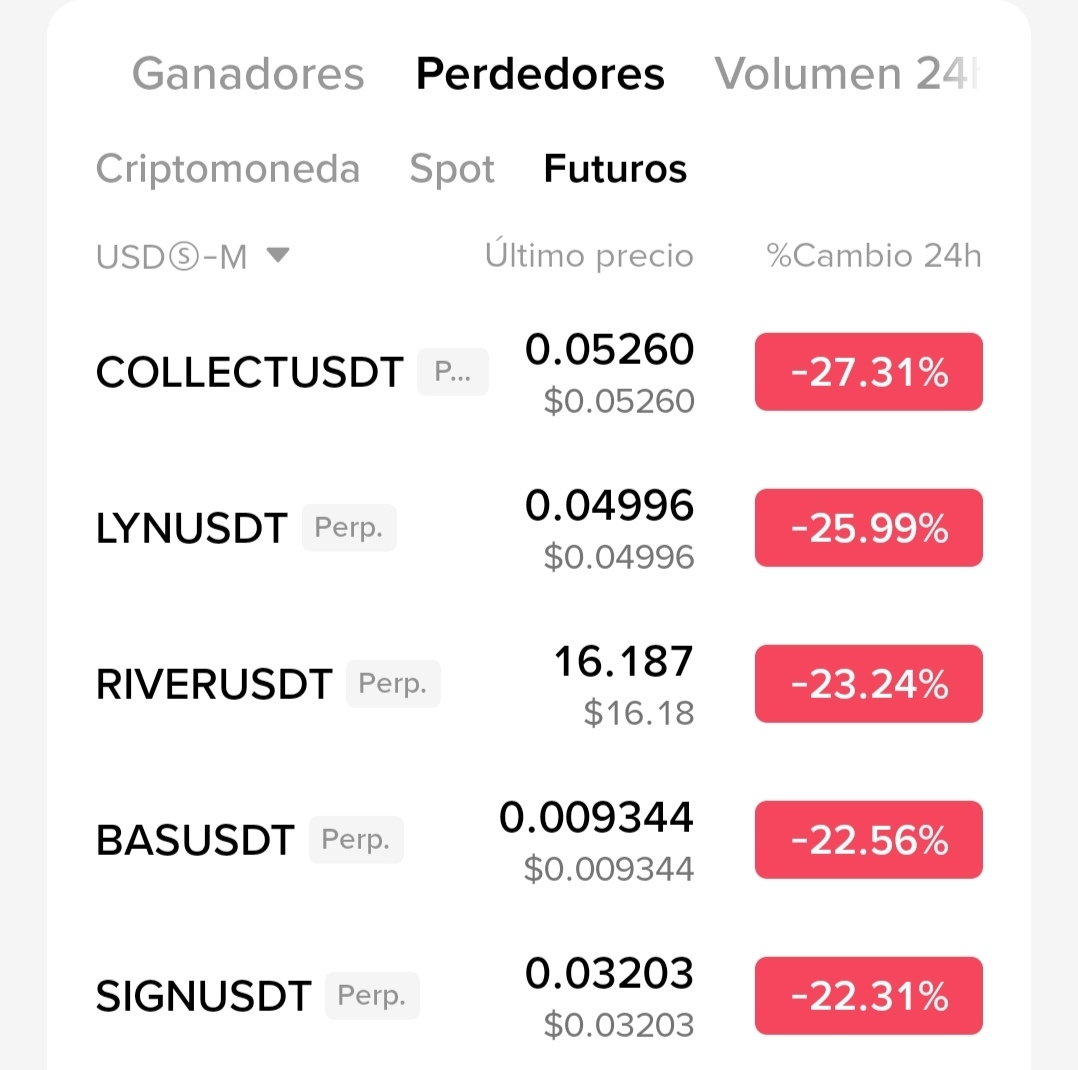
1. The "Support Breakdown" Trigger
The most common signal for a short position is when an asset breaks below a major support level—a price floor where buyers usually step in.
Case Study: Bitcoin (BTC) – March 19, 2026
Around March 19, following the FOMC meeting, Bitcoin tested a critical 0.236 Fibonacci support level at $69,028.
The Signal: Traders watched for a daily candle to close below this level.
The Logic: Once a floor is broken, it often becomes a "ceiling" (resistance). When BTC failed to hold $69,000, it opened the "trapdoor" for a move toward the $65,600 zone.
2. Bearish Candlestick Patterns
The "shape" of the price movement often tells a story of exhaustion. One of the most aggressive signals is the Bearish Engulfing candle.
What happened last week:
On the daily charts for March 19, Bitcoin printed a massive red candle that completely "swallowed" the previous day's green candle. This indicates that the "Bulls" (buyers) were completely overwhelmed by "Bears" (sellers). In professional lingo, this is a high-conviction entry point for a short trade.
3. The "Head and Shoulders" Warning
In the equity markets, specifically the S&P 500, analysts flagged a Head and Shoulders top on March 25.
The Pattern: A peak (shoulder), followed by a higher peak (head), and another lower peak (shoulder).
The Entry: Short positions are typically placed when the price breaks the "neckline"—the support level connecting the lows of the two shoulders. With the S&P 500 dropping 4.7% so far this month, this structural breakdown was a textbook warning.
4. Fundamental Catalysts: "Sell the News"
Technicals tell you where to enter, but fundamentals often tell you when.
Last week, the FOMC meeting on March 19 delivered a "hawkish" tone (indicating interest rates might stay higher for longer).
The Market Reaction: This created a "Negative Catalyst." In 8 out of the last 9 Fed meetings, Bitcoin has followed a "sell-the-news" pattern. Traders who recognized this historical trend combined it with the technical breakdown of $70,500 to secure profitable short entries.
The "Golden Rules" for Shorting
Never Short a Vertical Rocket: Wait for the trend to show "Lower Highs" and "Lower Lows."
The Stop-Loss is Non-Negotiable: Because an asset can technically go to "infinity," your losses on a short can be unlimited. Always set a hard exit price.
Watch the "Short Squeeze": If too many people short at once and the price ticks up, they all rush to buy back their positions to exit, causing the price to skyrocket. This is why we say: "Bears make money, Bulls make money, but pigs get slaughtered."
Quick Summary for your Dashboard:
Entry Signal: Break below $69,028 (BTC) or $2,135 (ETH)
Risk Level: High (Geopolitical tensions in the Middle East causing volatility).
Indicators to Watch: RSI > 70 (Overbought) and the 200-day EMA.

 LYNUSDTPerp0.0526+1.27%
 RIVERUSDTPerp13.98-0.07%
 SIGNUSDTPerp0.03235-0.94%
This happened to the tokens above.
Trade with caution