Bitcoin has fallen 44% from its all-time high of $126,000, as key technical and on-chain indicators suggest that BTC is entering the final phase of the bear market.

Bitcoin
BTCR$ 358,154
fell again on Thursday, with the price sliding below $70,000.
Analysts claim that the asset already shows typical signs of the final phases of a bear market, with extreme fear and high losses — both realized and unrealized.
Increase in losses among holders
The Bitcoin bear market has already caused the price to fall more than 44% from the all-time high of $126,000, recorded on October 6, 2025.
As a result, the Net Unrealized Profit/Loss (NUPL) indicator — which measures the difference between unrealized profits and losses — fell below 0.25, entering the so-called “hope/fear zone,” according to data from CryptoQuant.
$18.6 billion in Bitcoin options expire on Friday: traders should expect $75,000?
This means that “approximately 40% of the circulating Bitcoin supply is at a loss,” according to analyst The Enigma Trader, in a Quicktake.
In addition to this, the Fear and Greed index at “extreme fear” level (15) reinforces the scenario of pain and uncertainty in the market:
“A recovery of the NUPL above 0.25 would mark a transition to the optimism zone, historically associated with price strengthening.”
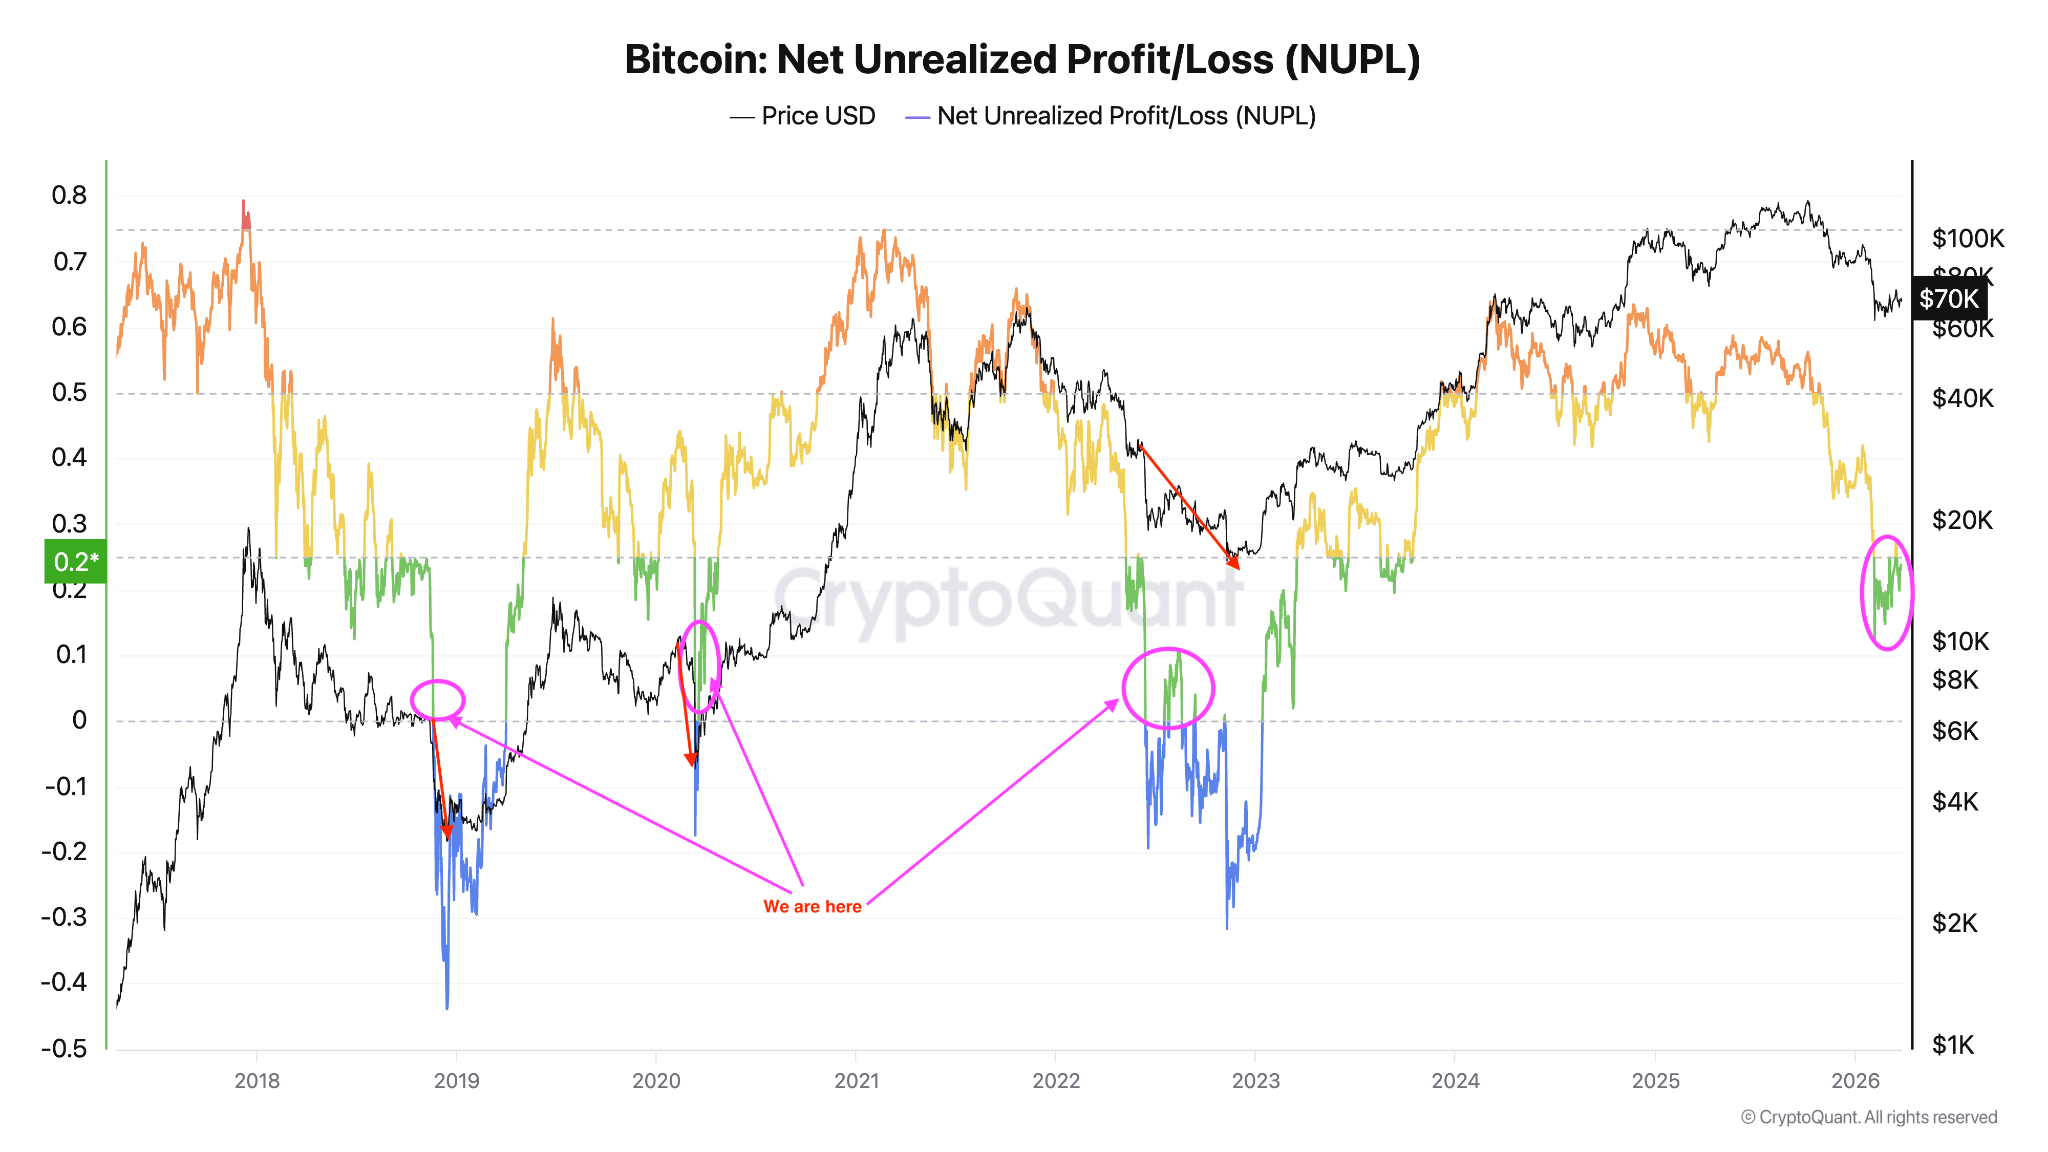 Realized and unrealized net profit and loss of Bitcoin. Source: CryptoQuant
This structurally resembles the conditions observed in previous bear markets, where the NUPL continued to fall to areas below 0 as Bitcoin found its bottom.
By analyzing the volume of coins held at a loss as a fraction of the total market capitalization, Glassnode found that the 7-day simple moving average (SMA) of relative unrealized losses has stabilized at 15%.
“This positions current sentiment as one of elevated fear,” said Glassnode in its latest newsletter Week On-chain, adding:
“Historically, resolving this level of embedded losses requires time, a greater price drop, or an extraordinary and sustained influx of new capital over a short period.”
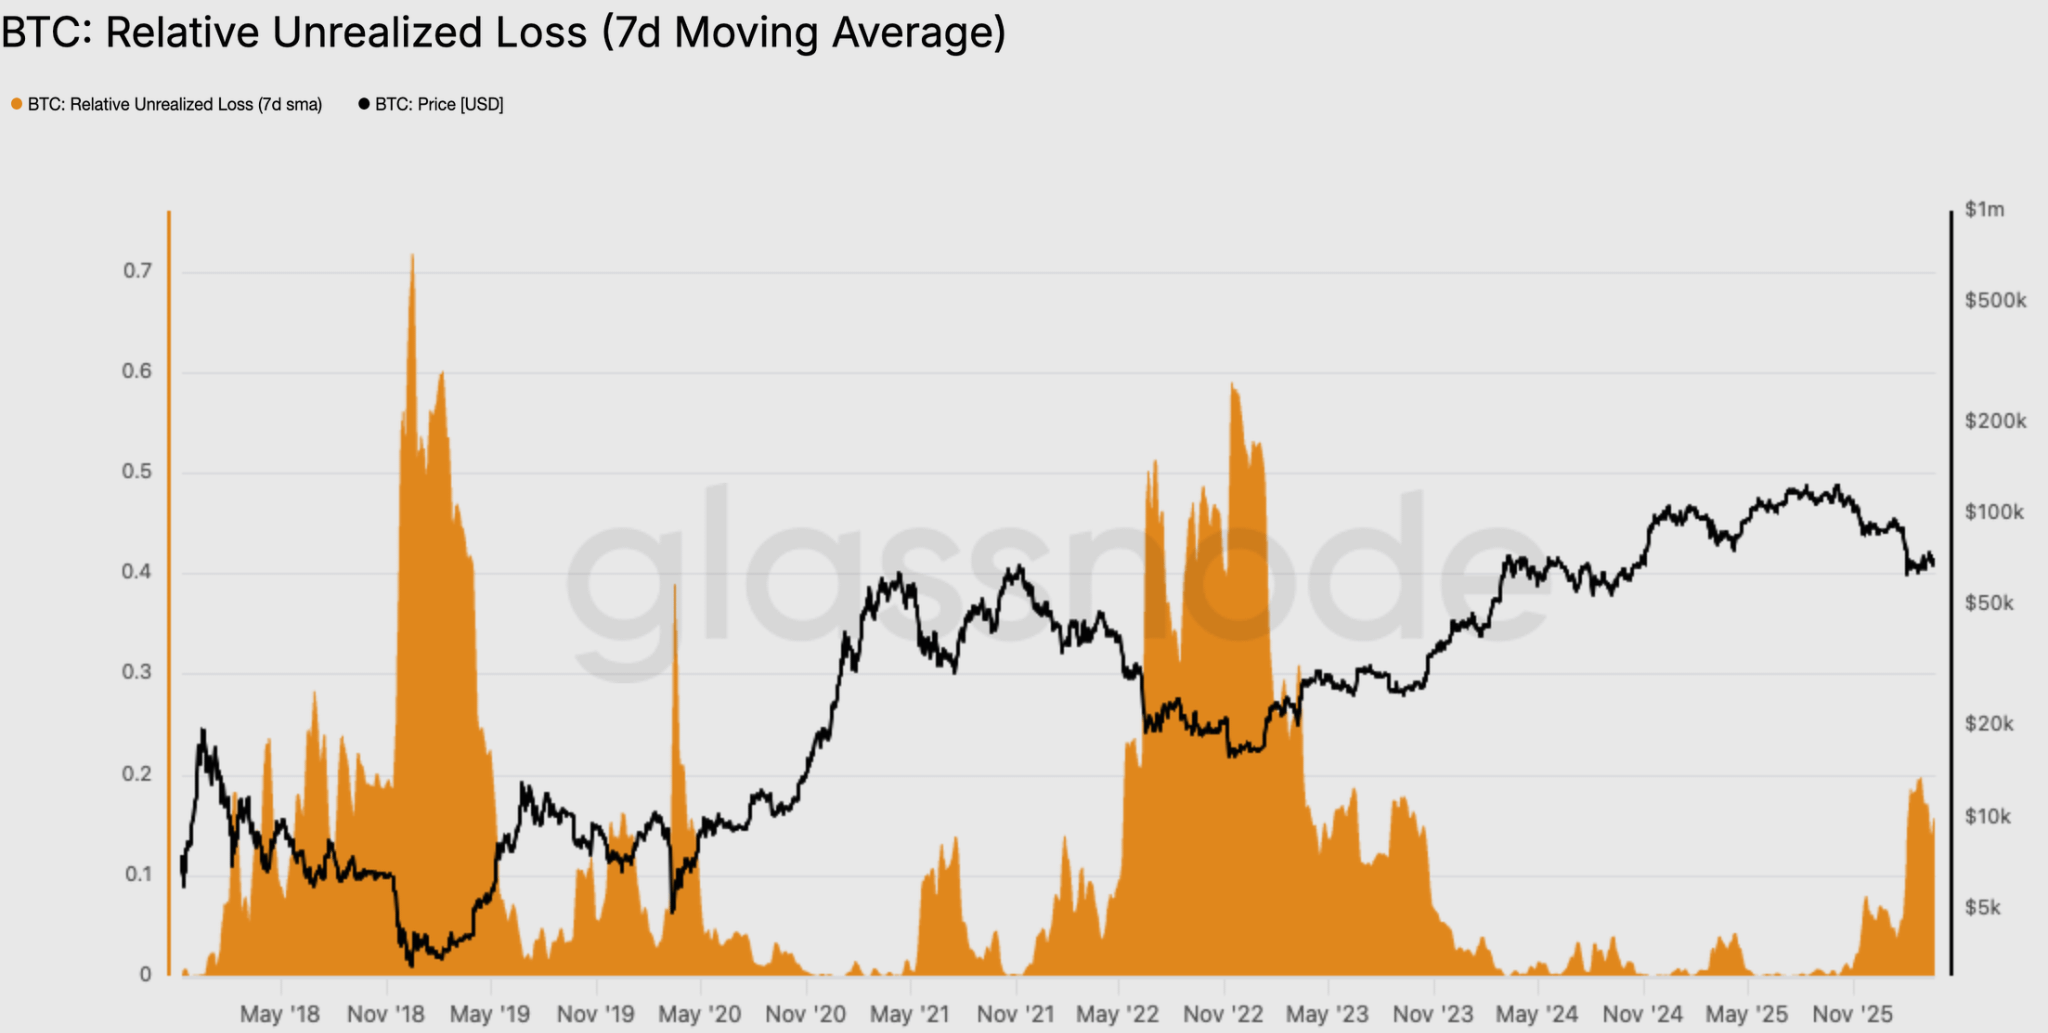 Bitcoin: Unrealized loss. Source: Glassnode
The realized profit adjusted by Bitcoin entity also fell from a peak of $3 billion per day in July 2025 to below $0.1 billion today.
This represents a decline of more than 96%, “providing more evidence of demand exhaustion,” said Glassnode, adding:
“Contractions of this magnitude are a classic characteristic of a bear market transitioning to its final stages, where the set of profitable sellers has been largely exhausted, and on-chain liquidity is reduced to cycle lows.”
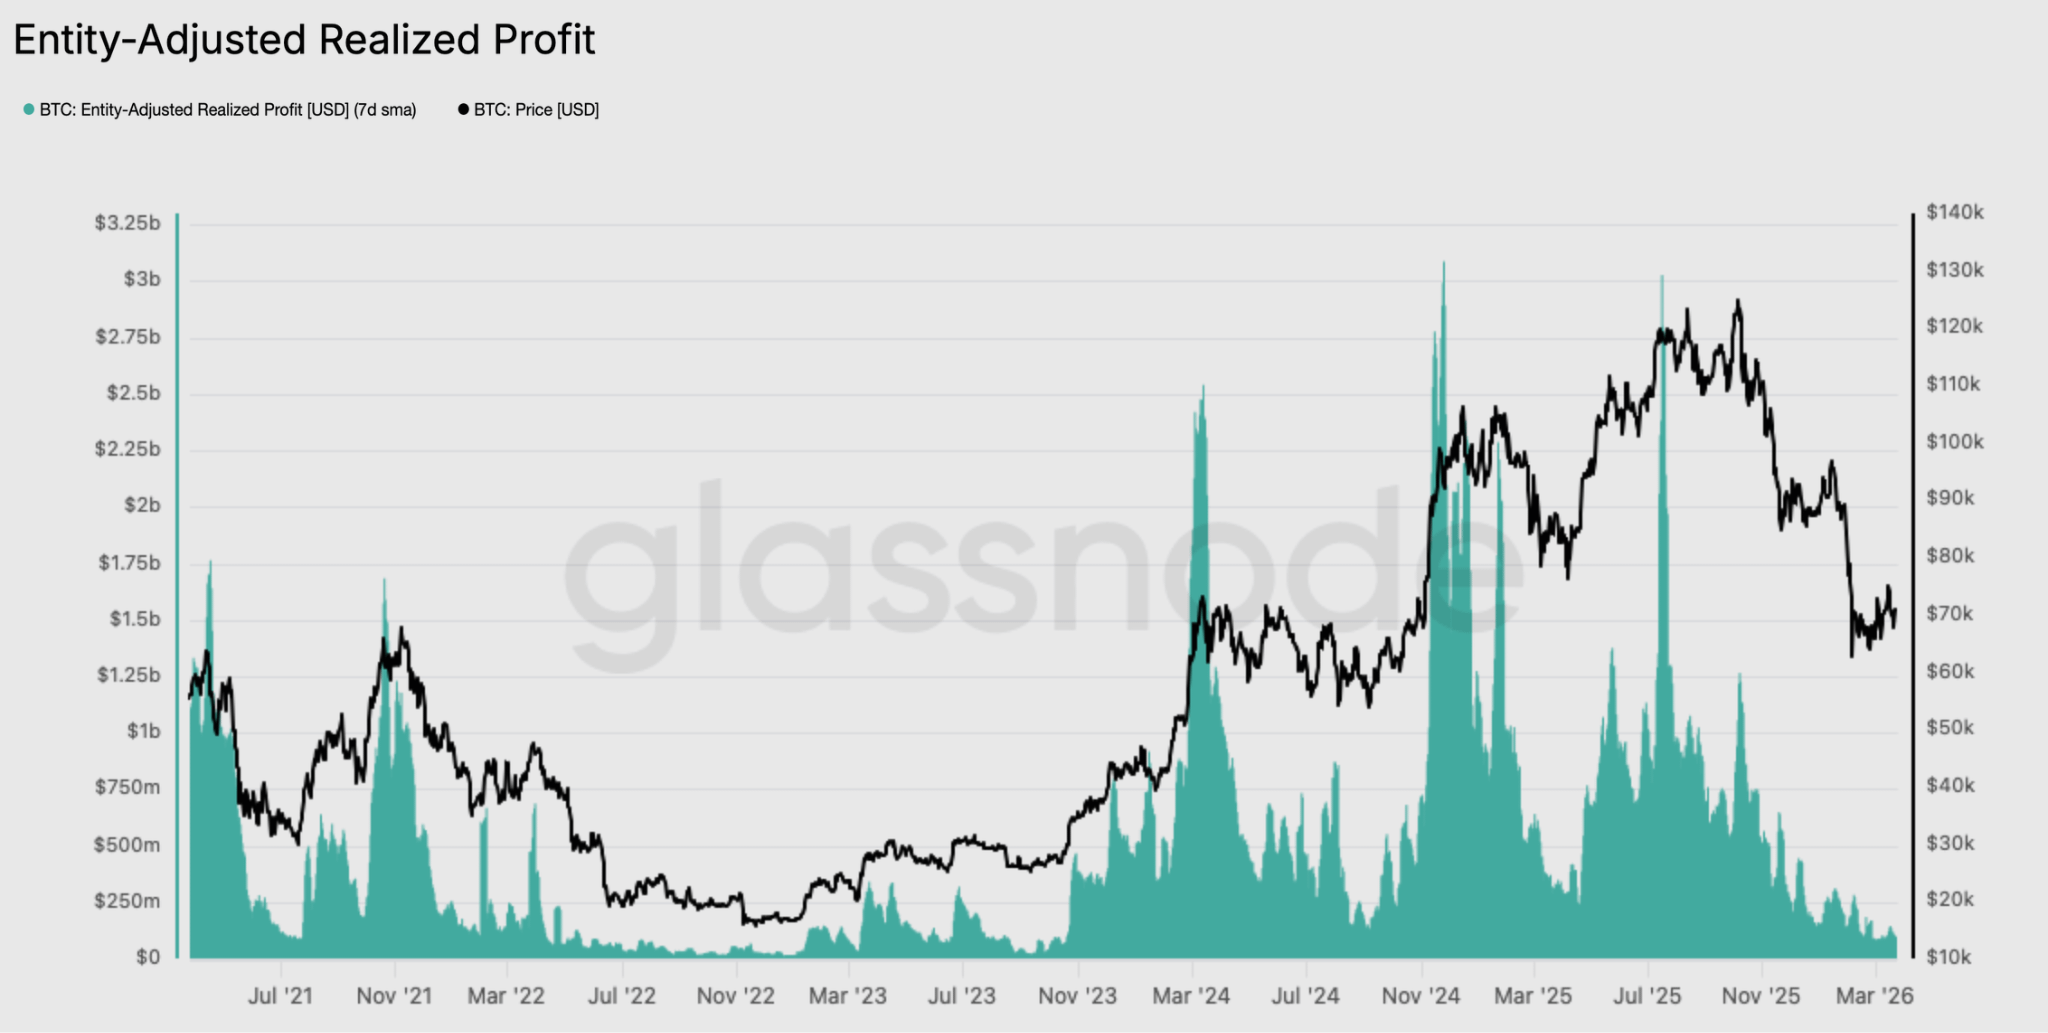 Realized profit adjusted by Bitcoin entity. Source: Glassnode
Meanwhile, CryptoQuant analyst Crypto Dan said that although some indicators suggest that BTC/USD has formed a bottom at $60,000, “more consistent and decisive confirmation signals” are needed to confirm a real bottom.
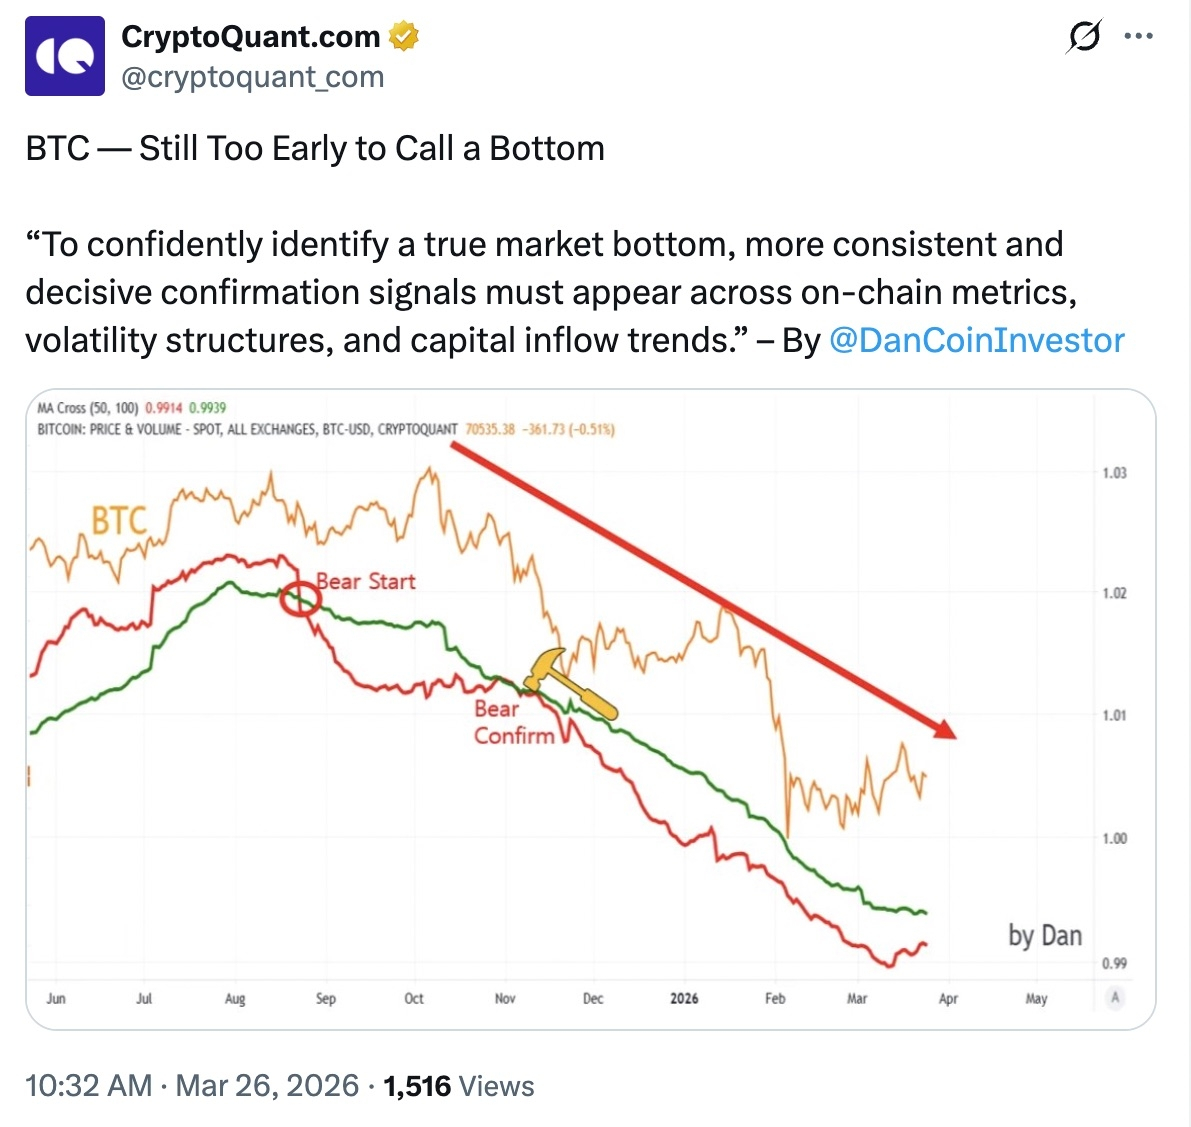 Source: X/CryptoQuant
Watch these Bitcoin price levels next
Since the recovery from multi-year lows below $60,000, the BTC/USD pair remains trapped in a range with support at $64,000 and $72,000 as resistance.
Bitcoin is now struggling to hold above the cost base of the group of 1 week to 1 month at $70,200, “marking the developing support floor,” said Glassnode.
However, the cost basis distribution heat map shows a modest accumulation cluster at this level, making it “vulnerable.” Glassnode:
“A higher probability of a break below this level cannot be dismissed until a more substantial base of committed buyers is established.”
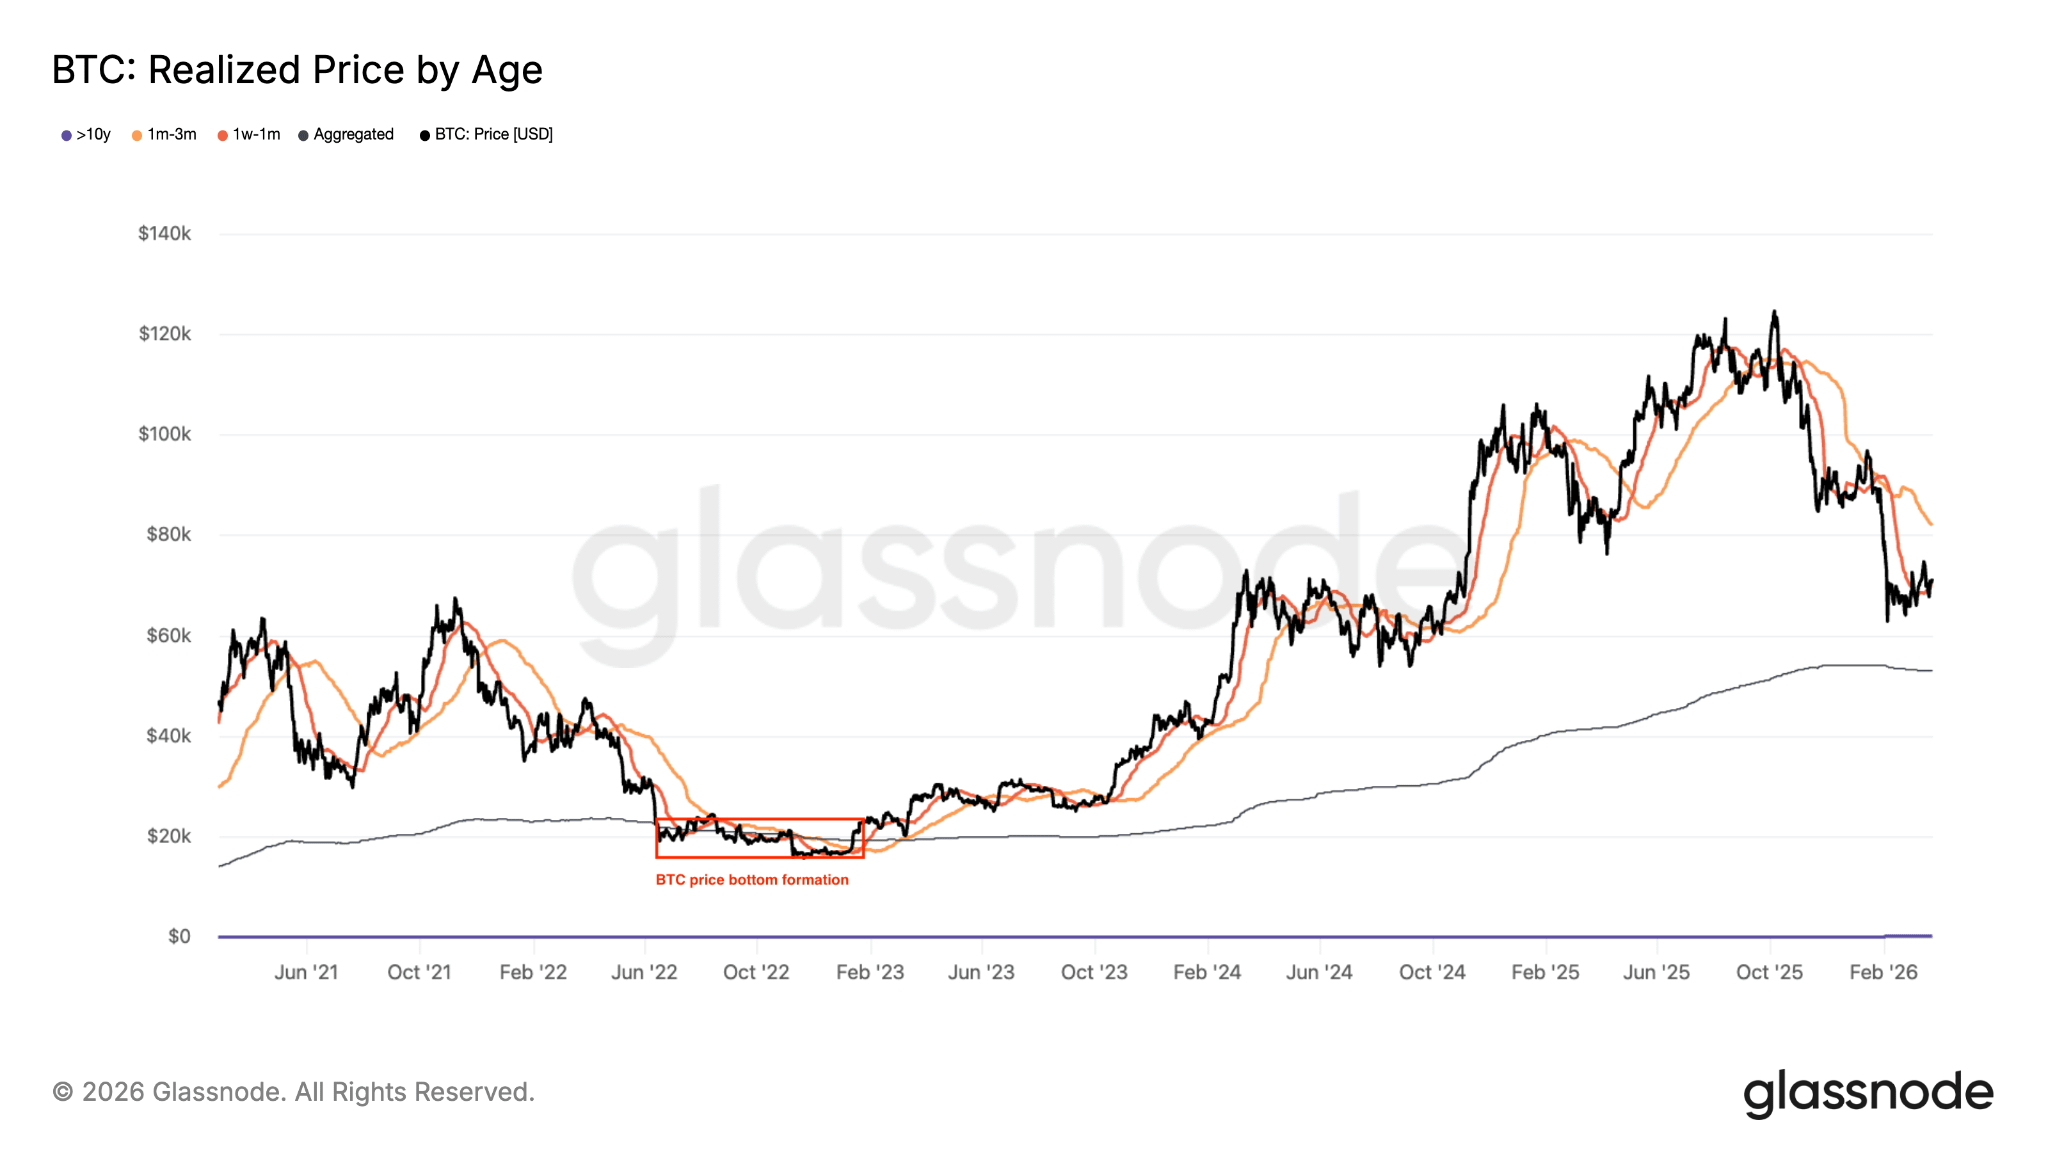 Bitcoin's realized price by age. Source: Glassnode
Below this, the next important level to watch is Bitcoin's realized price around $54,000. The bottom of the 2022 bear market was formed after Bitcoin fell towards its realized price.
On the positive side, Glassnode said that the cost base of the group of 1 to 3 months at $82,200 represents an important resistance above, coinciding with a strong concentration of short-term holder supply above $84,000.
This is a “group that can amplify selling pressure, whether when the price makes a recovery towards these levels or faces a new episode of market stress,” added Glassnode.
In a post on X on Thursday, technical analyst CryptoPat said that the recent high of Bitcoin up to $76,000 was just a lower peak, adding that the higher timeframe structure points “down from here,” with the next real area of interest situated below $50,000.
“Even if $76K is broken, there is another block of sell orders between $86,000 and $90,000 just above.”
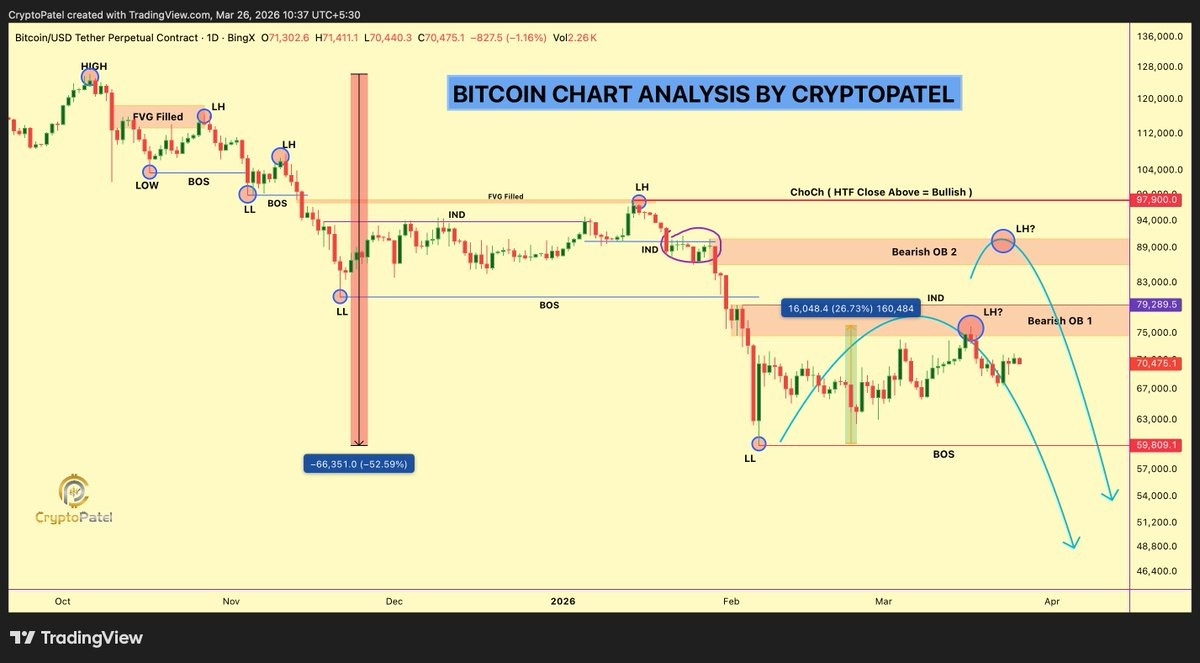 Daily BTC/USD chart. Source: X/Crypto Patel
As reported by Cointelegraph, a close below the 20-day exponential moving average at $70,303 could drive BTC down towards the support zone between $62,500 and $60,000.