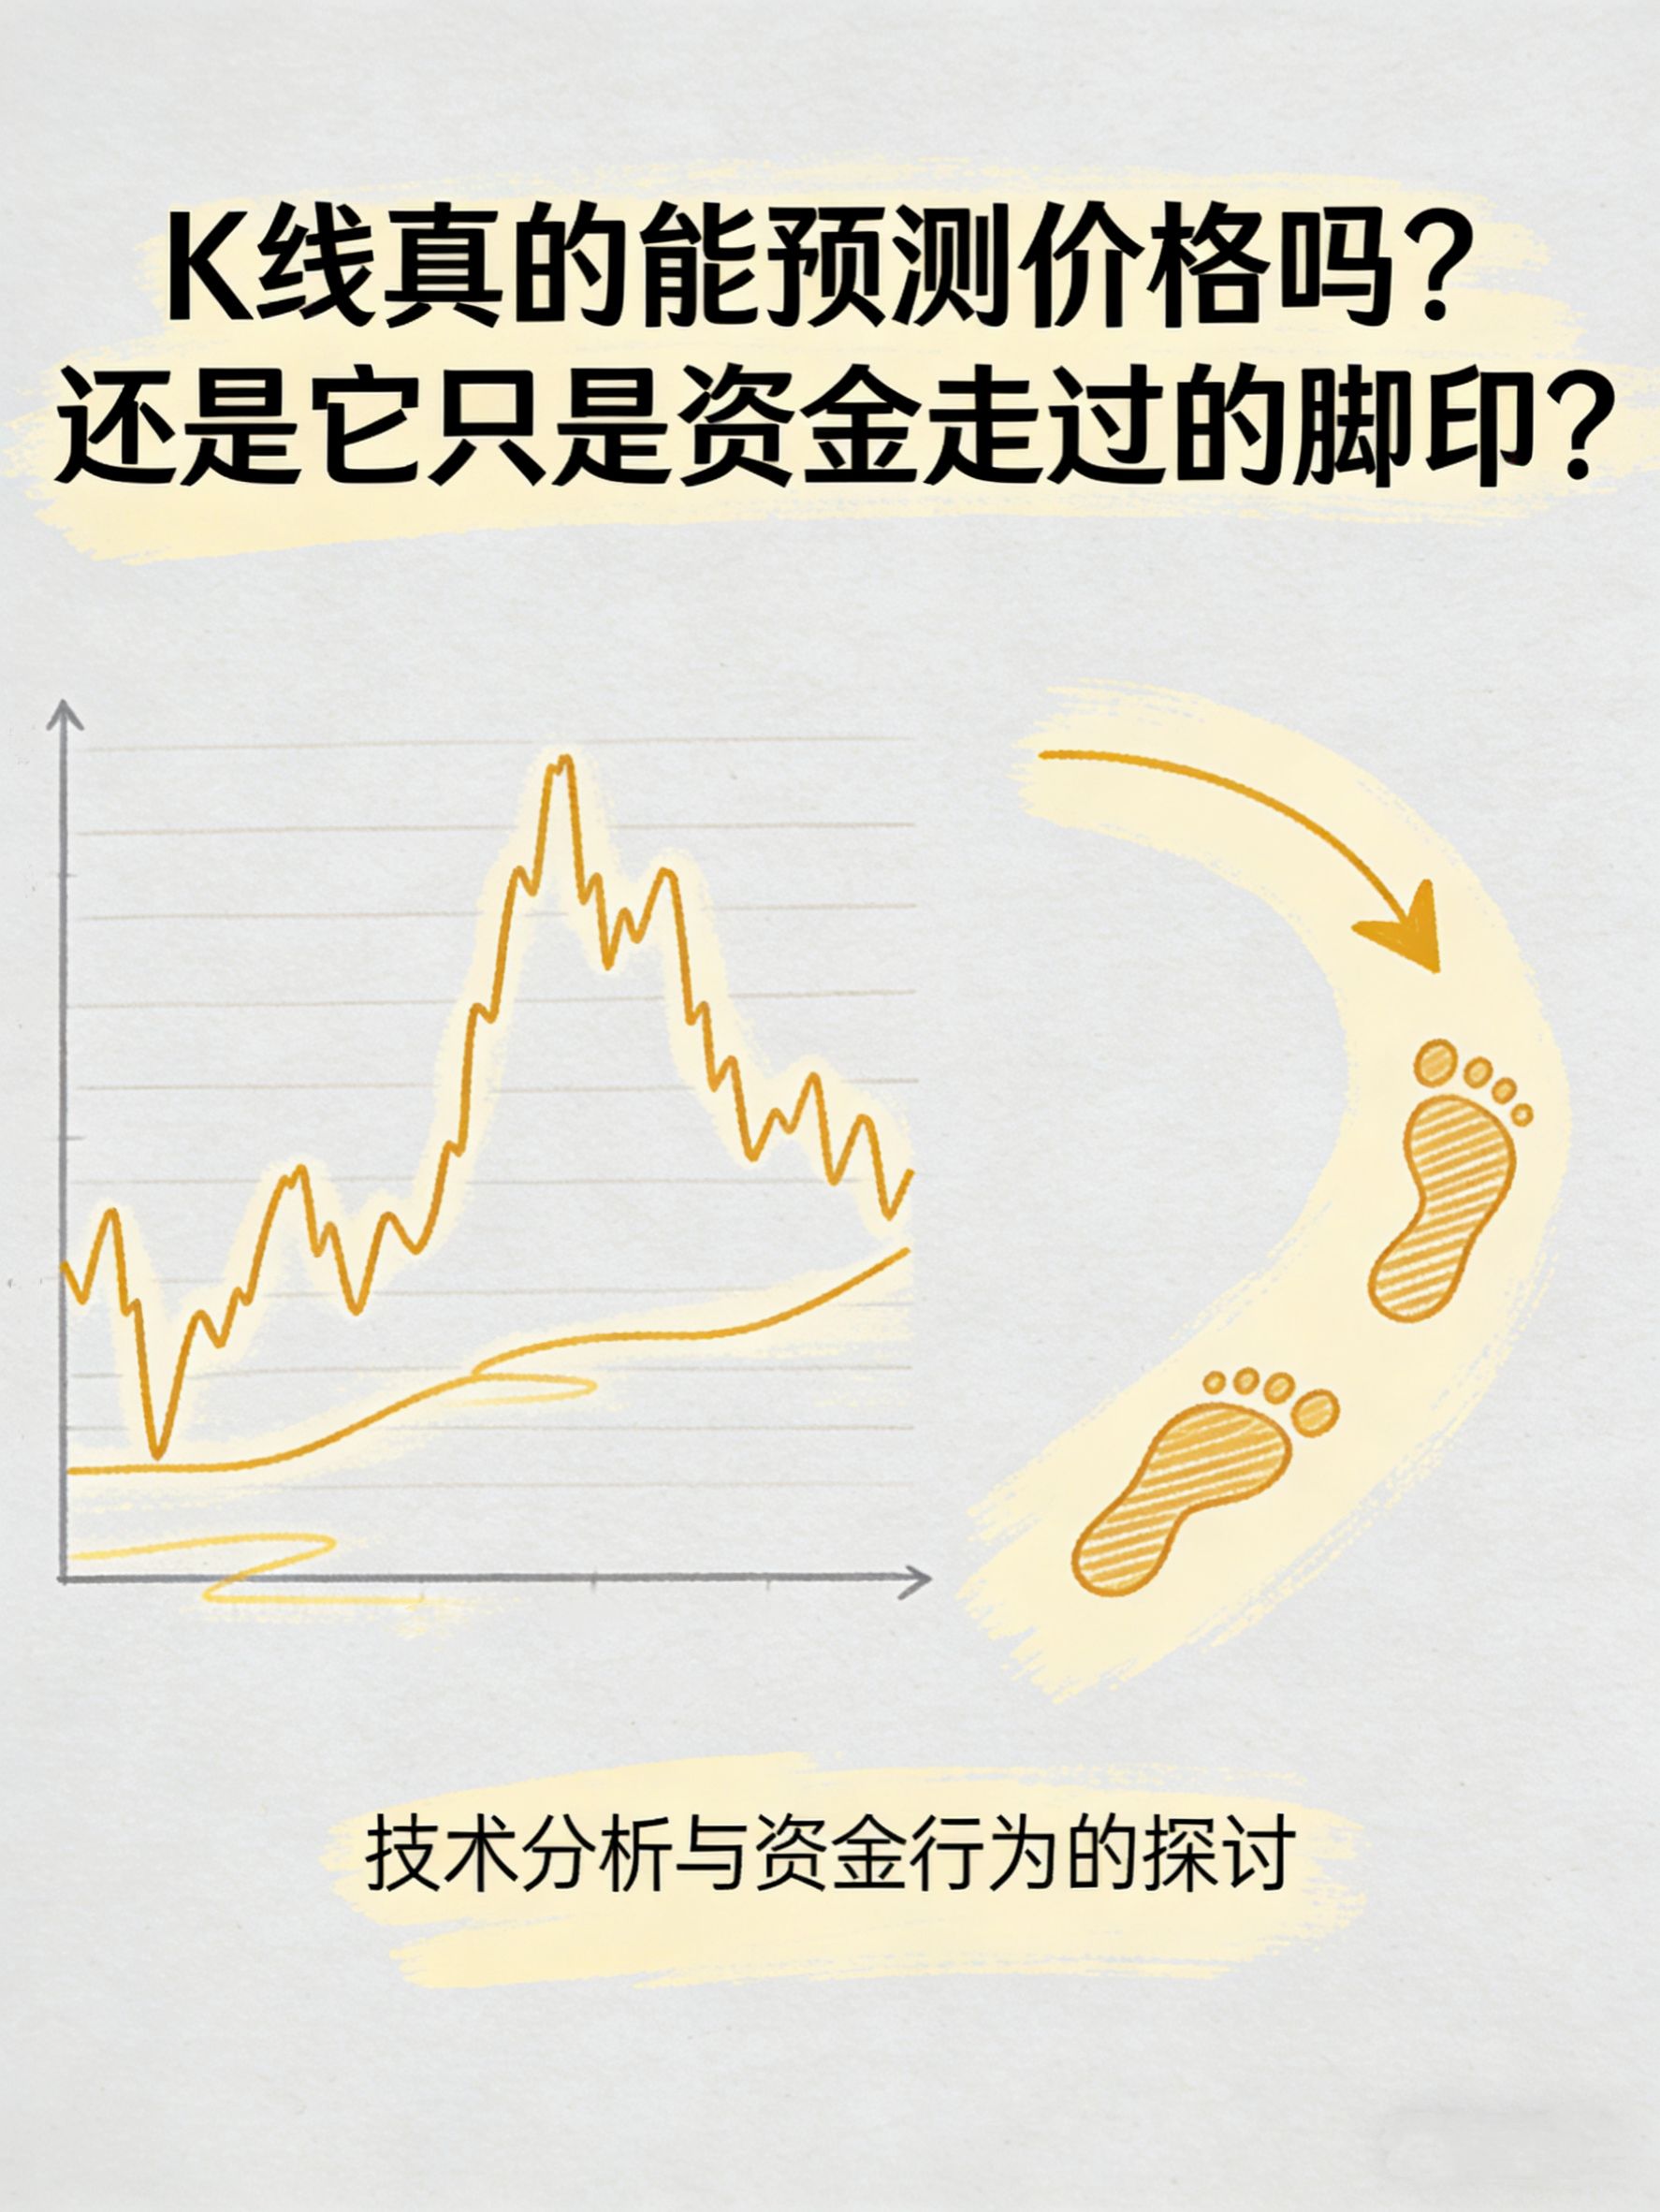
1. Are you still trying to find the sword by carving the boat while looking at the candlestick?
Many brothers have been staring at the golden cross and dead cross, MACD, red and green bars on the screen all day, and the result is that as soon as they buy, it drops, and as soon as they sell, it takes off. The truth is: you think the candlestick is the pulse of the market, but it is actually just the foam left after the tsunami of funds recedes. If you talk about support while facing the foam, who won’t drown?
2. The physical essence of candlesticks and the truth of the game
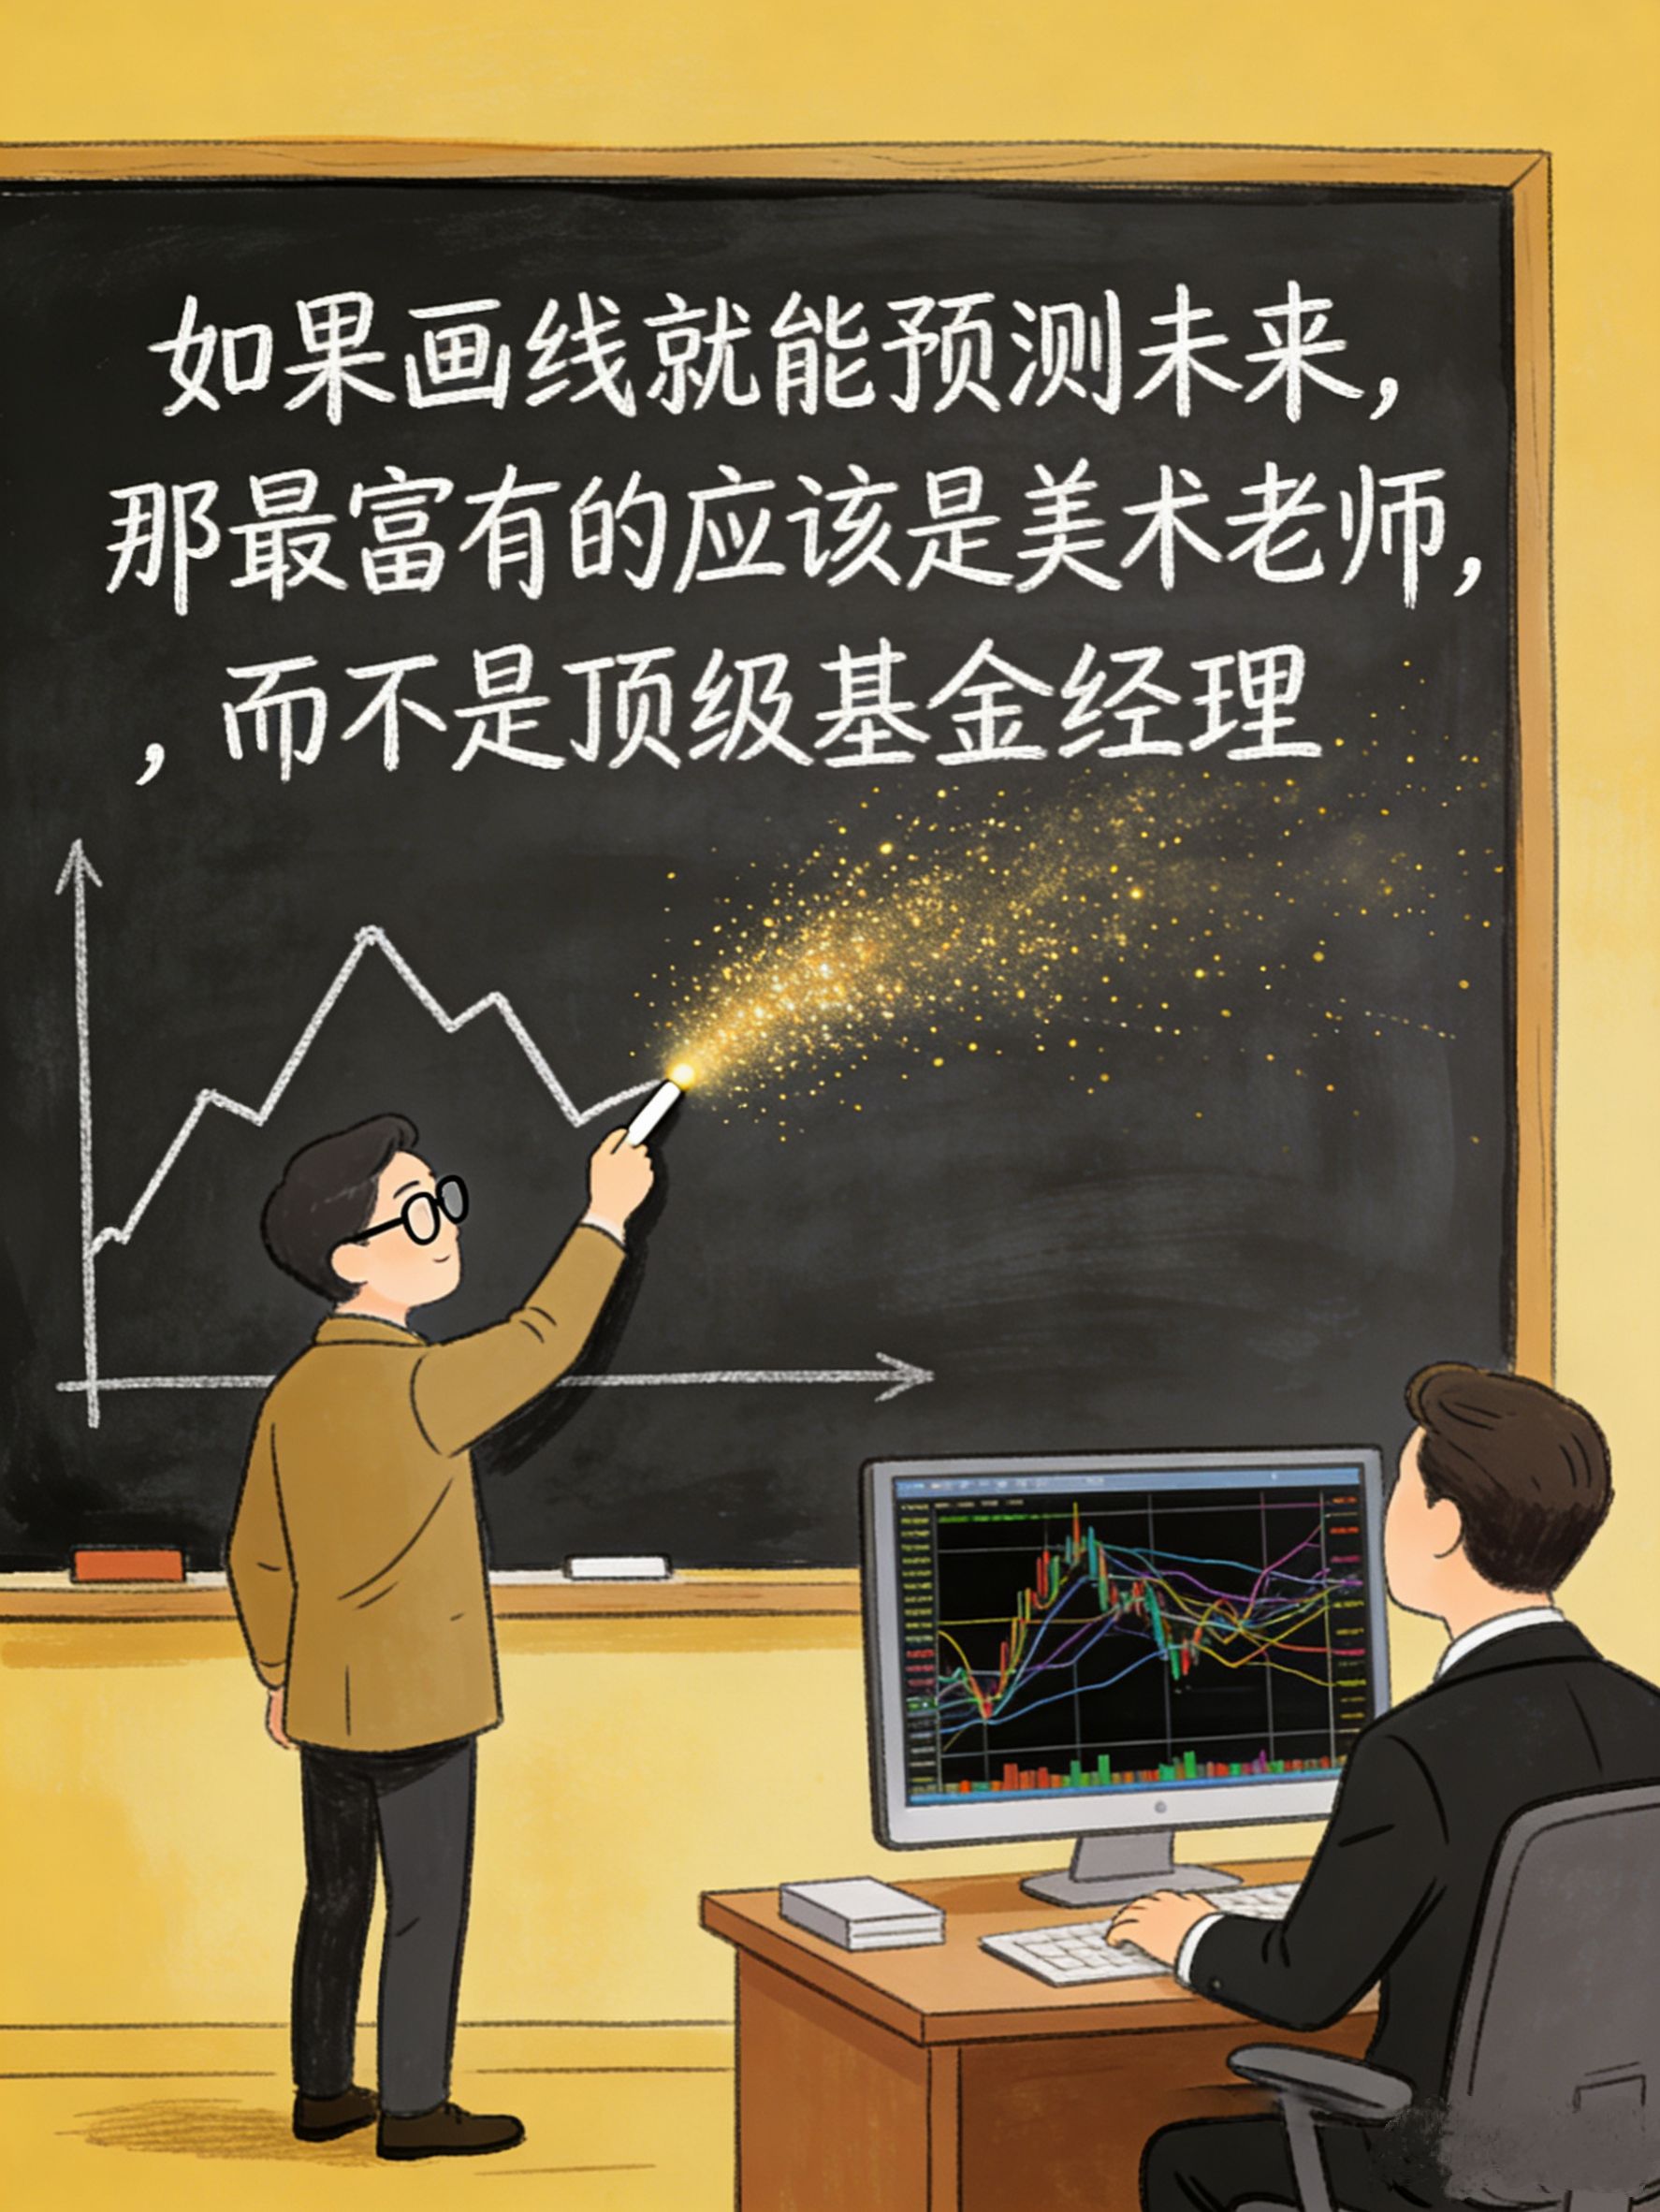
From the perspective of financial engineering, candlesticks are essentially a time-weighted aggregation of transaction data. They do not possess predictive power; they only have historical retrospective power.
The lagging performance of capital flow: price fluctuations are driven by the imbalance between proactive buying and passive selling. Candlesticks merely record the results of this 'capital game'.
Consensus coordinates: the reason support and resistance levels are effective is not because the lines have magic, but because of reflexivity. When global investors are all focused on a certain support or resistance level on the daily chart, that area becomes a concentration zone for liquidity.
The traps of adaptive markets:Algorithmic trading often exploits retail investors' obsession with classic patterns."Directional trading."
3. These 'picture-based' operations are the most dangerous!
In the highly volatile market of cryptocurrencies, the following three behaviors can easily lead to financial losses:
Chasing red and killing green: the candlestick color change is merely a matter of the past few minutes and does not represent the trend for the next few minutes.
Memorizing pattern diagrams: head and shoulders, double bottoms, if there is no accompanying trading volume, then it's just noise randomly drawn by a computer.
Superstitious about small cycles: the candlestick fluctuations of 1 minute and 5 minutes are mostly random walks; looking for patterns there is like trying to find music in noise.
Always remember, large capital enters the market first, then comes the fluctuation of candlesticks. Don't get the cause-and-effect relationship reversed.
4. Logical Summary of the Following Preparation
This is my opening work. We reveal the mysterious veil of candlesticks, confirming that they are merely records of capital flow, not crystal balls.
The core of this article:
We have clarified that 'capital is the cause, and candlesticks are the result.' Only by understanding the 'gravity' and 'consensus' behind candlesticks can you transform from a spectator into a trader who understands the nuances.
The next article discusses:
Since candlesticks are just footprints, why do some 'footprints' look particularly solid?
In the next article, we will discuss: why does the support level you draw keep getting broken? Is it 'false support'? Don't let those paper-thin support levels cause you to lose your principal again!
This article was first published in Binance Square, aiming to dissect personal practical trading systems and logic, and is not intended as investment advice. Markets are risky, liquidity fluctuates rapidly, maintain independent thinking, and protect your principal.