💡 Summary of technical analysis for Bitcoin indicators RSI and MACD
The current Relative Strength Index (RSI) for Bitcoin is very low at around 16.82, indicating that Bitcoin is in an oversold area, which could mean a potential buying opportunity if followed by a price reversal.
The MACD indicator shows that the MACD line is still below the signal line, with a negative histogram, indicating a continuation of downward momentum in the near term.
Currently, there are no strong positive signals from other indicators like BOLL or KDJ supporting an immediate bullish reversal.
A detailed explanation of the RSI and MACD indicators in Bitcoin analysis.
The RSI indicator measures the strength and size of recent price movements to determine whether the asset is in an overbought or oversold condition. When the RSI is below 30, as it is now, it indicates that Bitcoin may be oversold and may see a bullish rebound soon.
The MACD indicator relies on the intersection of moving averages to determine the direction of momentum. Having the MACD line below the signal line with a negative histogram indicates the continuation of the downward trend, and any potential bullish crossover should be monitored as a buy signal.
Using other indicators like BOLL can help identify dynamic support and resistance levels, but currently there are no clear signals from these indicators.
These indicators combined give a picture of the current market state for Bitcoin, where the RSI indicates the possibility of the end of the downward trend, while the MACD confirms the continuation of the downward momentum so far.
Tips:
It is important to monitor Bitcoin as it often affects overall market movements.
Since the RSI indicates oversold conditions, consideration can be given to cautiously increasing exposure while placing tight stop-loss orders to reduce risk.
Following economic and regulatory news is very important as it affects Bitcoin's overall movements.
Data from the trading interface in the images:
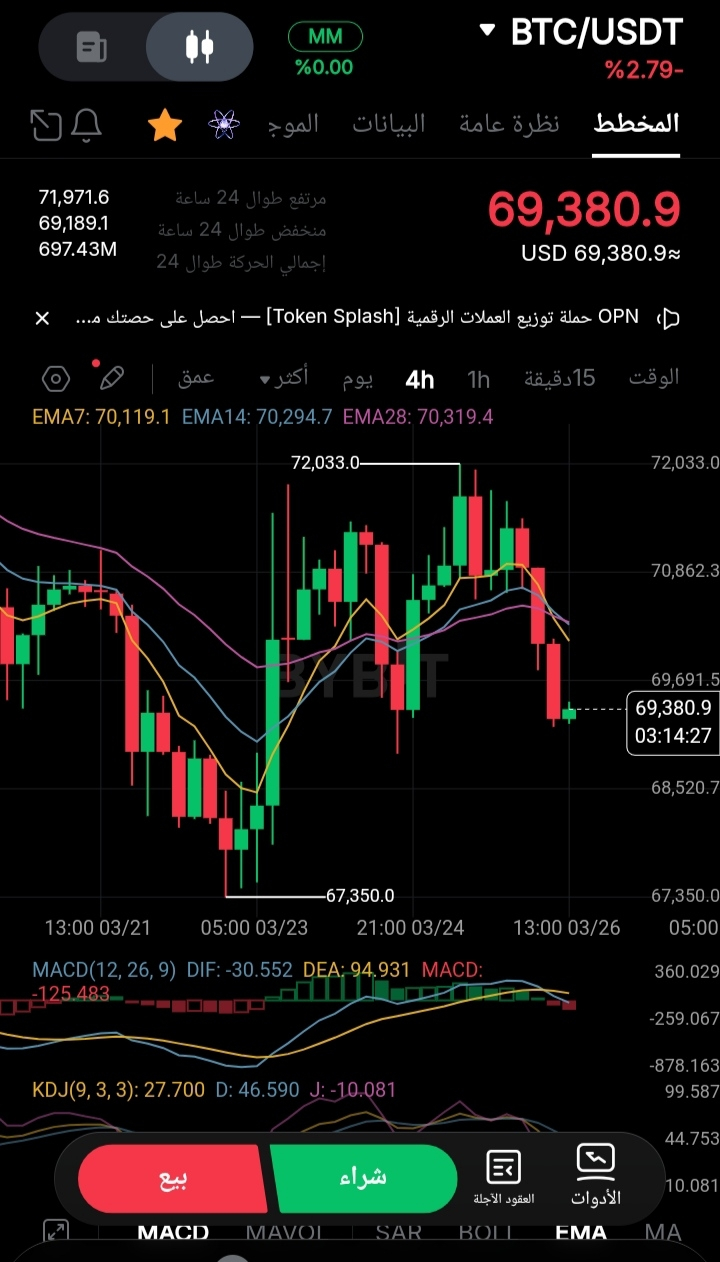
BTC/USDT: 69,380.9 (2.79%-)
The price range in the images: High (71,971.6) / Low (69,189.1)
Visible suggestions:
Set the BTCUSDT contract network between 66131.8 and 76053.9.
Open a sell position on the BTCUSDT perpetual contract with a limit price of 94240.3.
