Analysis made on the 4h chart (amateur French trader):
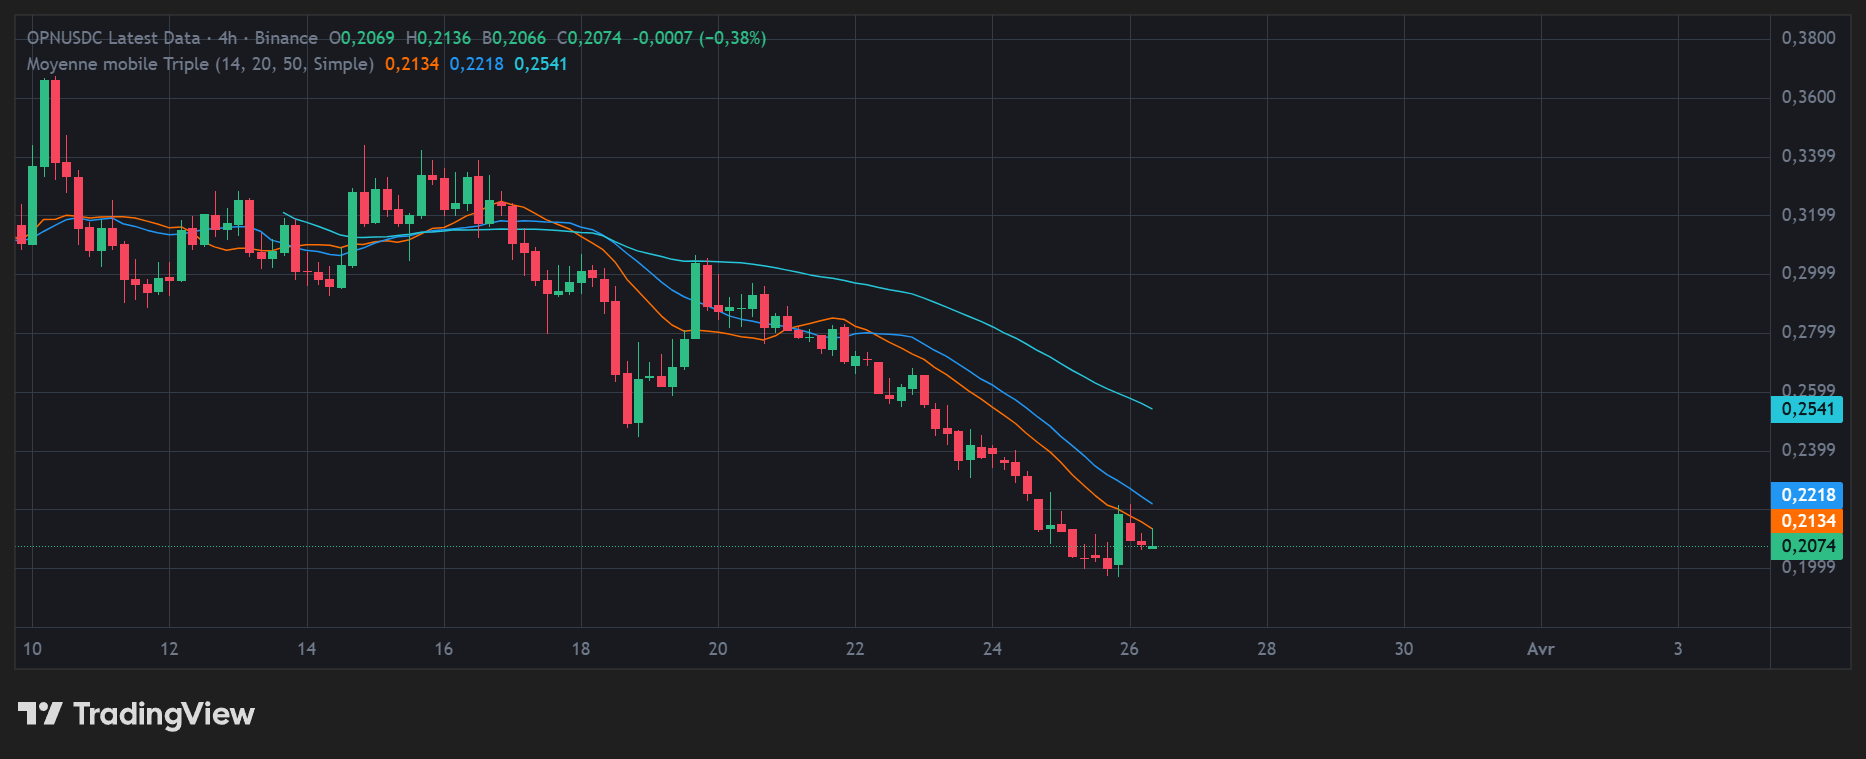
The price has only bounced off the MA 14 since the candle on Saturday, March 21, 21:00 2026 (French Time) until Wednesday, March 25, 2026 21:00 when this resistance was broken. This can serve as an indication for a price increase of $OPN . (First Image)
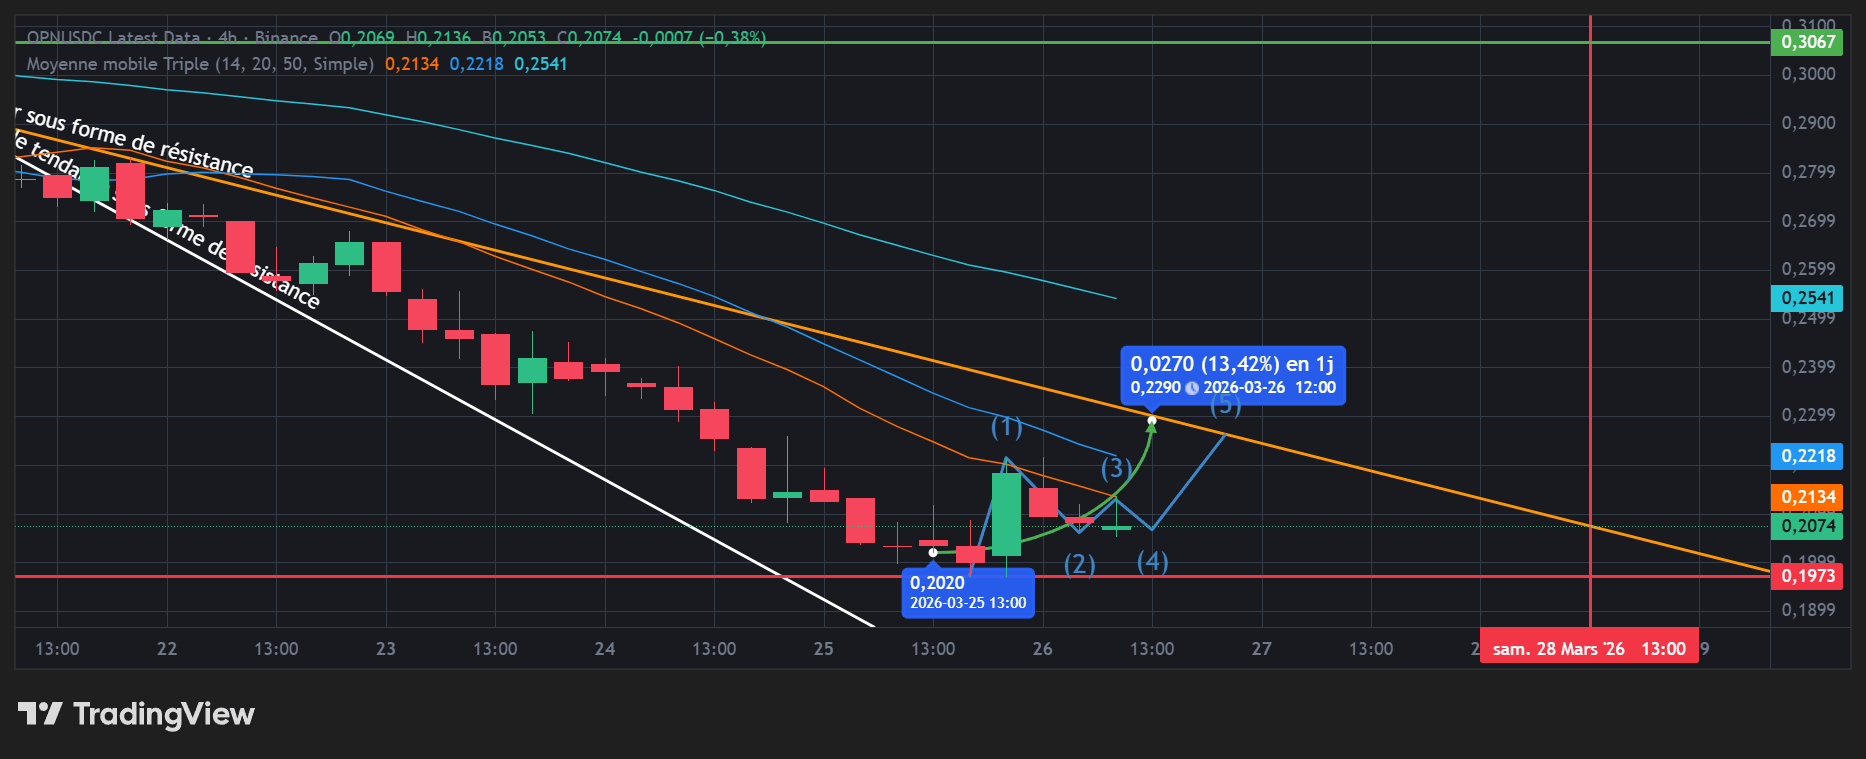
Then, it is sufficient for the chart to show us a new higher low than the previous one, which is at 0.1973, to be able to hypothesize about when the price might reach these values.
There are two outcomes:
Either the new support will be created in the next candle (from 13:00 to 17:00) or this will take place later in a scenario where it would be appropriate to buy as the RSI would be below 40 (or even lower than 30).
We will be able to observe my hypotheses on when the price increase will occur with the help of my Elliott wave of impulse and when the price will reach the expected price, that is to say between 0.2260 and 0.2290 (price adjusted by my forecast made in green). (Second Image)
The recent bounce on the MA 14 at the price level of 0.2136 suggests that the second option is more likely, and thus an increase could occur following a second break of the resistance on the MA 14.
Here is my analysis on why the price of $OPN could reach 0.2260-0.2290 in the next 4-hour candles.
Thank you for your reading.