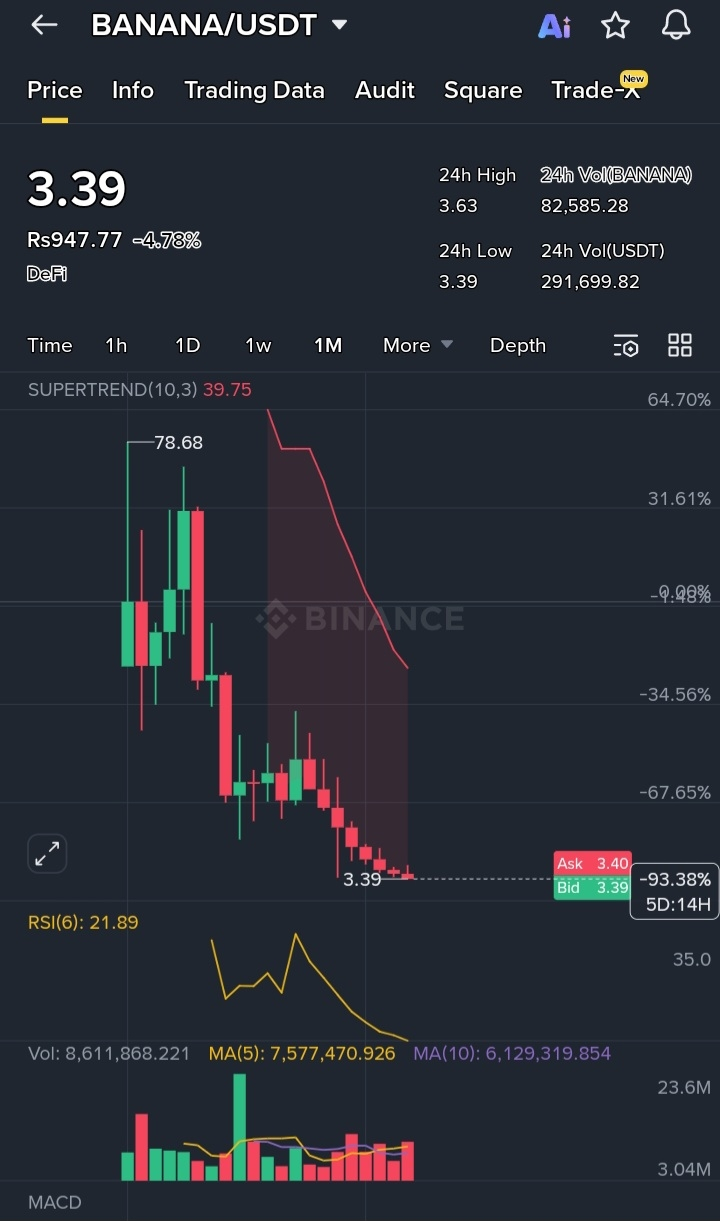
Price Action: The token is in a clear downward spiral, currently sitting at its 24h low of 3.39. It has dropped over 93% from its previous highs shown on this timeframe.
Indicators: The Supertrend is deep in the red, and the RSI(6) is at 21.89, which is heavily oversold. While some might see "oversold" as a buy signal, in a crash, it often means the momentum is just overwhelmingly bearish.
Volume: We aren't seeing a massive "capitulation spike" yet, meaning the bleeding might just continue slowly.
Market Update: BANANA Slips as Sell Pressure Mounts
The recent price action for BANANA/USDT has been anything but sweet for holders. After failing to maintain its mid-range support, the token has entered a steep decline, currently trading at 3.39—down nearly 5% in the last 24 hours and hovering at its daily low.
Key Bearish Factors:
Broken Support: The chart shows a consistent "lower low" pattern. The aggressive red zone indicated by the Supertrend suggests that every minor relief bounce is being met with immediate selling.
Oversold but Weak: While the RSI has dipped into the low 20s—traditionally "oversold" territory—there is a complete lack of buyer exhaustion. Instead of a sharp bounce, the price is "hugging" the bottom, signaling that the floor may still be further down.
Market Sentiment: With a total 24h volume of roughly 82k BANANA, liquidity appears thin, making the price highly susceptible to further slippage if any remaining large holders decide to exit.
The Bottom Line: Unless BANANA can reclaim previous support levels with a significant surge in volume, the path of least resistance remains downward. Traders should exercise extreme caution; catching a falling knife in this macro environment often leads to further losses.