📊【Start Timing】
$BTC$BTC There is a magical rule in history—
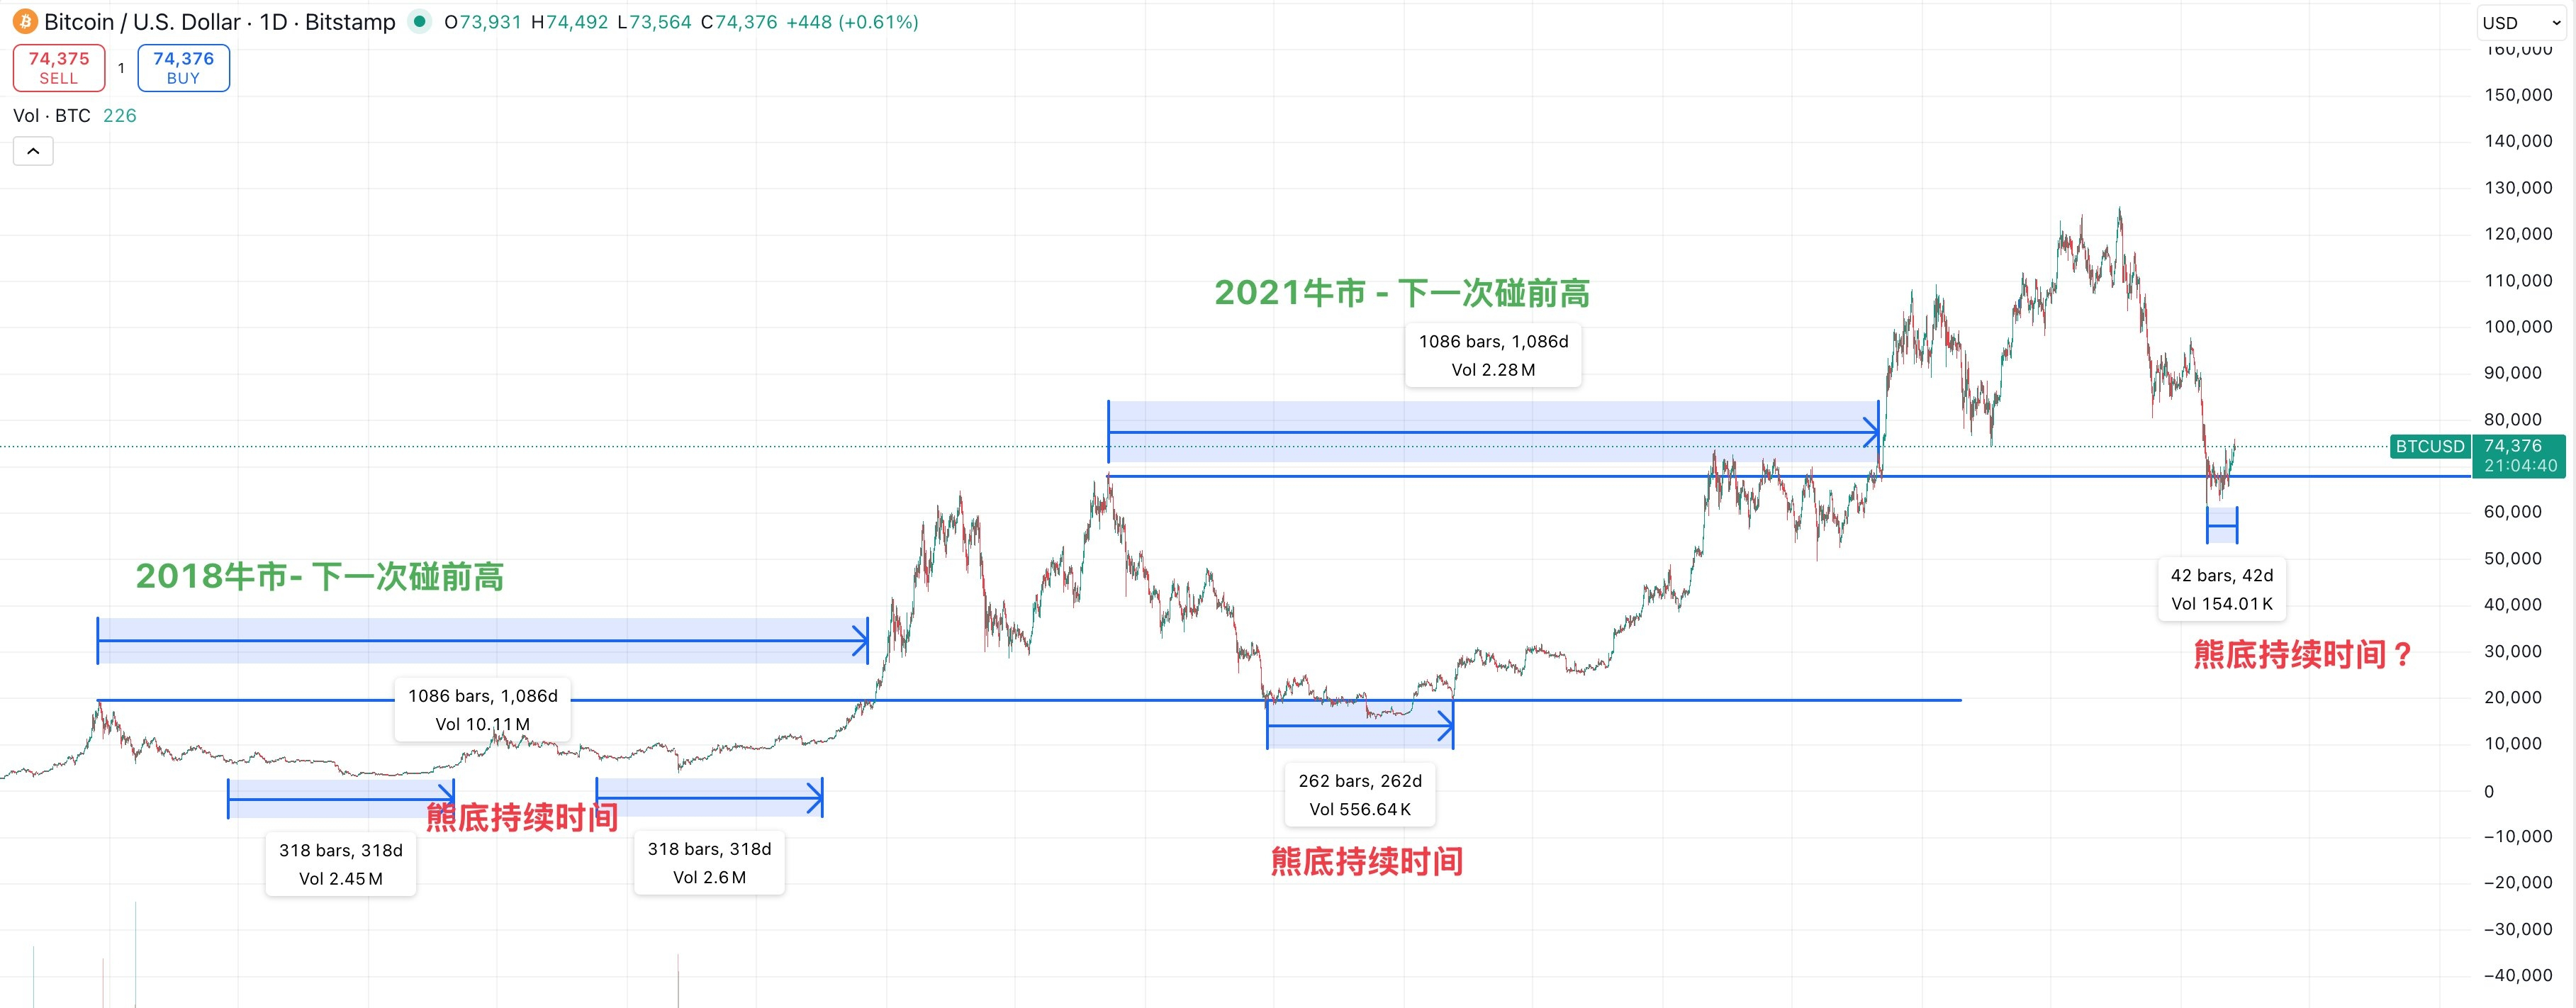
In every bull market, from the previous high to the next touch of the previous high, the time is surprisingly close:
▶ 2018 → 2021 Touching the Previous High: 1086 Days
▶ 2021 → 2024 Touching the Previous High: 1086 Days
Twice, the same number.
——————————————
Looking at the duration of the bear bottom:
▶ 2019 Bear Market Stayed at the Bottom: 318 Days
▶ 2022 Bear Market Bottom Took: 262 Days
▶ This round touched the previous high until now: only 42 days
42 Days vs 262 Days—The Difference is Vast.
If historical patterns hold, this round's bear bottom is likely not yet over.
——————————————
[Carved Complete]
Of course, the act of carving a boat to seek a sword is only a historical reference, not a prophecy.
The structure of participants and the macro environment change with each cycle; patterns may continue or be broken.
But at least one thing is certain:
42 days is still too short.
Click $BTC to follow real-time market trends 👇
Do you think this round of the bear market is over?
Comment with your judgment 👇
⚠️ The above is historical data for reference and does not constitute investment advice. Please manage risks properly.
#BTC #Bitcoin #CycleAnalysis #BearMarket #OnChainData #BinanceSquare #加密货币