Sit more comfortably. Now I will lay out the imbalance for you as it is seen by those on the other side of the glass – market makers, prop traders, and those who feed liquidity to the crowd. This will not be another article on 'the basics.' This will be the inner workings.
1. Anatomy of imbalance: passive vs aggressive, or how we 'remove' stops
Let's start with the main point. When a novice sees a huge column of green orders in the order book (DOM), he thinks: “There are many buyers here, the price will go up.” But this is passive imbalance – it is just limit orders waiting to be “eaten.”
Real strength is in aggressive imbalance. This is when someone is smashing the order book with market orders (market buys/sells). This is visible on the tape (time & sales) and on the cluster chart (footprint).
How we, market makers, create artificial imbalance to trigger stop losses
Imagine: at the level of 50,000 there is a cluster of stop losses (or liquidity from a big player). If the price approaches this level from above, we (or big funds) start to act:
1. Fake passive imbalance on sale. We place huge limit sell orders (passive ask) just above the current price. The order book “weighs” 1.5 thousand BTC. Traders see a wall of sellers – fear, they do not press.
2. Seller pressure simulation. We launch a series of small market sell orders, creating a red delta on the footprint. This looks like a “bearish imbalance.”
3. Provocation and liquidity capture. As soon as the price starts to go down “heavily” and breaks a local minimum, stop losses on buying (or stop losses on selling, if we are going the other way) will trigger. But the main thing is that the stop losses of those who were sitting in longs below will also trigger.
4. Reverse aggressive imbalance. At this moment, we remove our limit sell orders (which were never a real intention to sell) and initiate an aggressive market buy (buying all the liquidity that stop losses have thrown out). On the tape – a wall of green trades, delta sharply goes up, and the price shoots up.
Key detail: true profit is not earned on trends, but on stop liquidity. Passive imbalance in the order book is often decoration. Aggressive imbalance on the tape (if it is not supported by further continuation) is a “trace” of absorption.
2. Hidden liquidity mechanics: how to read the footprint to avoid falling into a trap
A professional looks at Delta (the difference between aggressive buying and selling) and CVD (Cumulative Volume Delta). But here are the nuances:
Trivialities that save the deposit
1. Spread behavior. If there is a huge red imbalance (many aggressive sales) appearing on the footprint, but the spread (the difference between bid and ask) narrows instead of widening – this is a red flag. A true panic sale widens the spread. A narrowing of the spread during pressure means that market makers are ready to absorb this flow. High probability of reversal.
2. Delay in updating the order book (DOM latency). In markets with low liquidity (or during volatile moments) pay attention: if the order book “freezes” for a second, and then large volumes suddenly disappear – this is a sign that a big player has removed their limit orders to avoid being “eaten” during aggressive movement. If you see a freeze, and then the price flies through the level without resistance – this is not a breakout, this is a trap.
3. The pattern of “absorption.” The most important pattern. You see on the footprint: at a certain level (for example, at the high/low of the day) a huge volume appears (say, 500 contracts), but the price does not move further and starts to reverse.
· Example: The price reaches 50,000. On the footprint, at this tick, there is +2000 delta (buying), but on the next tick, the delta is minus 2500, and the price returned below 50,000. This means that someone aggressively bought out all the willing sellers and then immediately turned around and sold even more. This is classic position accumulation before a reversal.
3. Insider details: order flow, icebergs, and “dark pools”
How brokers sell order flow
Yes, this is not a conspiracy theory. Brokers (especially CFD and some crypto exchanges with PFOF – payment for order flow) sell information about where retail traders' stop losses and limit orders are to big funds and hedge funds. Funds receive this data with a millisecond delay, but for them, it is a “treasure map.” They see clusters of retail liquidity and deliberately go there to collect it.
How an ordinary trader can see an “iceberg” (Iceberg)
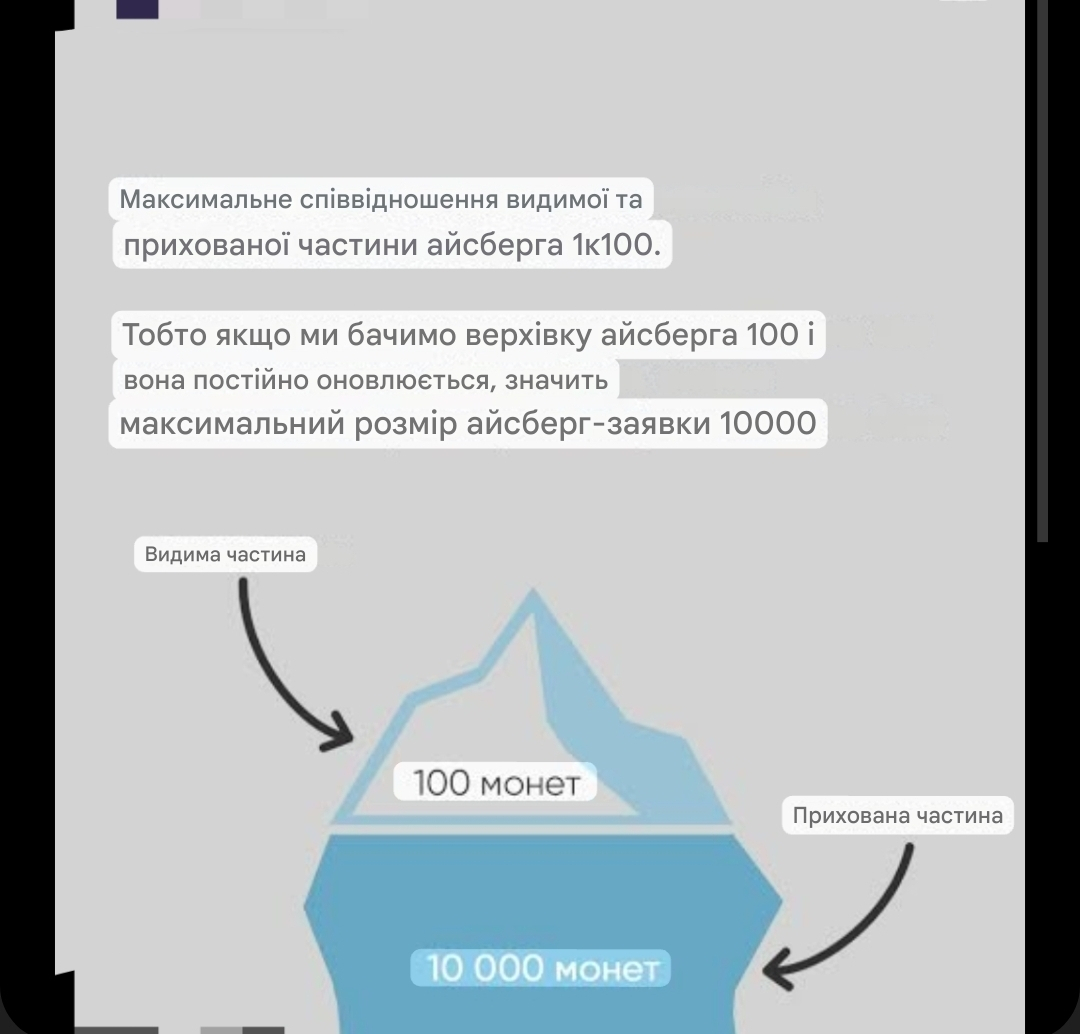
An iceberg is a huge limit order broken down into small pieces so as not to reveal its actual size.
Signs of hidden accumulation:
1. Rhythmic recovery of the order book. You see that at the bid (or ask) a consistent volume appears (for example, 10 BTC) every 2 seconds after it is eaten. These are not random traders – this is an algorithm that maintains liquidity.
2. Flat delta during price movement. The price slowly goes up, while the cumulative delta (CVD) stays the same or decreases. This means that the movement is not due to aggressive buying, but because someone is removing their limit sell orders, allowing the price to “float” upward. This is pure manipulation. True movement is always accompanied by an increase in delta.
4. Great secrets: why high buying imbalance kills the price
This is the moment that breaks the psyche of novices.
Paradox: You see a huge green column on the footprint (+5000 delta). You buy. The price falls. Why?
Because you saw the result, not the reason.
A big player (fund) wants to take a short position at the top. How can he do this? He cannot just hit “sell” – it would crash the price down, and he wouldn't accumulate the needed volume.
It acts differently:
1. He places a huge passive bid (limit buy order) just above the current price.
2. Traders see this “buyer wall” and start buying, pushing the price up to this bid.
3. When the price reaches, the fund aggressively sells (market sell) directly into its own passive bid.

4. On the footprint, this tick shows a huge green imbalance (because the fund bought a huge volume passively, but also aggressively sold). But the net delta of this movement is negative because there were more aggressive sales than purchases.
5. The price falls, the fund remains in short.
Conclusion: Do not look at absolute values of imbalance on a single tick. Look at the cumulative delta (CVD) and whether the price confirms this movement.
Liquidity Grab and Stop Hunting
This is the foundation of foundations. The market moves not where there is a lot of liquidity now, but where liquidity will be later. Big players always go in the direction opposite to the cluster of stop losses.
If there is a huge number of stop losses from those who entered short above an important level (for example, a monthly high), professionals will break this level, collect the stops (immobilize liquidity), and then reverse.
Volume Profile and POC: how to filter out noise
The true interest of institutions is not candles, but volume profiles. The POC (Point of Control) zone is the price where the most trades occurred during the session. If the POC is below the current price, but at the same time, on the footprint, you see buying imbalances that cannot break the POC upwards – this is a bearish trap. And vice versa.
Rule: Noisy imbalances are those that occur far from the POC or from the Value Area High/Low (VAH/VAL). We ignore them. We only work with imbalances at the edges of the Value Area, where big players are forced to defend their average price.
5. Practical strategy: how to distinguish spoofing from a real reversal
Spoofing is placing huge limit orders with no intention of executing them, to create a false impression of pressure. This is prohibited on regulated markets, but in crypto – please.
Algorithm of actions (on the example of cluster chart and DOM):
1. Identify the level of interest. Look at the Volume Profile. Choose a level where there is a cluster of volume (POC) or an extreme.
2. Wait for the approach. The price approaches the level. A huge limit order appears in the order book (for example, for sale).
3. Watch the delta on the footprint.
· If this is spoofing (trap): On the footprint at the moment of touching the level, delta will be minimal (no aggressive sales). The price seems to “fear” touching this wall. A large order in the order book disappears as soon as the price approaches too closely. Then the price sharply flies in the opposite direction.

· If this is a real reversal (absorption): When the price touches a level, a huge imbalance appears on the footprint in the opposite direction to the movement. For example, the price goes down, reaches support, and at this tick, delta shows +2000 (aggressive buying). Meanwhile, on the next 2-3 ticks, delta remains positive, and the price begins to reverse.
Critical volume ratios
In professional trading (especially in futures), there are unwritten “numbers”:
· The ratio of aggressive to passive volumes at a key level: If the volume of aggressive orders (market) exceeds the volume of passive (limit) at the same level by 3-5 times, and the price does not continue to move in the direction of aggressive imbalance – this is 100% absorption. Entry against the direction of aggressive flow gives a risk/profit ratio of 1:5 or more.
· Delta divergence: When the price updates a maximum, and the Cumulative Volume Delta (CVD) makes a lower high – this is divergence, which indicates that buyers are running out of steam. Entering a short after such a signal will likely lead to a liquidity stop zone.
Summary for real trading
1. Do not trade the order book (DOM) head-on. Use it only to identify anomalies (sudden disappearance of walls).
2. Footprint (Footprint/Cluster) + CVD – your Bible. If there is no confirmation from delta, the movement is false.
3. Your advantage is in patience. Professionals create imbalances so that you believe in them. Your entry should occur after the aggressive imbalance (which you see on the footprint) has been absorbed by the opposite imbalance. This is called “entry after absorption.”
4. Place stops where others place liquidity. If you place a stop behind an obvious level (fresh high/low), know that this liquidity will be collected. Either place the stop further than the area of stop accumulation, or use volume analysis to enter only after the trap has been triggered.

This is the information that is not given away in free webinars. There are no “trend lines” and “Fibonacci levels.” This is pure mechanics of money redistribution. If you learn to see not candles, but the real order flow and distinguish where the passive trap is and where aggressive absorption is, the market will stop being a casino. It will become your infrastructure for liquidity withdrawal.
Remember: there are only two entities in the market – the one who creates liquidity (market maker) and the one who consumes it (retail). Do not be a consumer. Be the one who reads the flow.