#اخبار_اليوم #عملات_رقمية #اقتصاد_رقمي @everyone #wct #كريبتو #العملات_الرقمية #تداول #استثمار #بيتكوين #تعلم_التداول #دعم_ومقاومة #Zcrypto $BNB
Bitcoin is currently trading near $70.3 thousand.
The market has seen Bitcoin liquidations worth $249 million.
Bitcoin is currently trading in a key volatility zone, known as the trading ban area, between $65,636 and $70,685. This range has seen intense activity, with over 1.72 million Bitcoins traded. This makes it a strong support and resistance area. The movement of buyers and sellers creates a state of uncertainty in the market.
As long as the price of Bitcoin does not exceed 70,685 US dollars or drop below 65,636 US dollars, a clear trend is unlikely to form. Furthermore, a breakout could lead to bullish momentum, while a collapse may result in further declines. Currently, the market remains in a wait-and-see phase.
Bitcoin, the dominant currency, has been trading within its narrow range over the past few weeks. It has failed to break out of the bearish zone and has dropped below 70,000 US dollars. At the time of writing this report, Bitcoin is trading within the range of 70,335 US dollars, with daily trading volume increasing by more than 56.41% to reach 43.34 billion US dollars. A liquidation of 249.04 million dollars was also observed over 24 hours.
If the bearish grip on Bitcoin intensifies, red candles may appear, with the price dropping to a critical support level at 69.9 thousand dollars. Assuming sellers continue to dominate the market, the downward pressure will increase, potentially leading to the emergence of a death cross pattern.
However, if the current trend of the Bitcoin market shifts to bullish, the price may rise to find a major resistance level at 70.7 thousand dollars. With the increasing strength of bullish pressure, bulls may start to form a golden cross pattern, leading to a gradual price increase.
Bitcoin's momentum has declined: Are we witnessing more losses?
The Moving Average Convergence Divergence (MACD) line and the signal line for Bitcoin are below the zero line, indicating bearish pressure on the market. The price is trending downward, with sellers in control and difficulty in maintaining an upward trend. This supports a continued decline unless momentum changes.
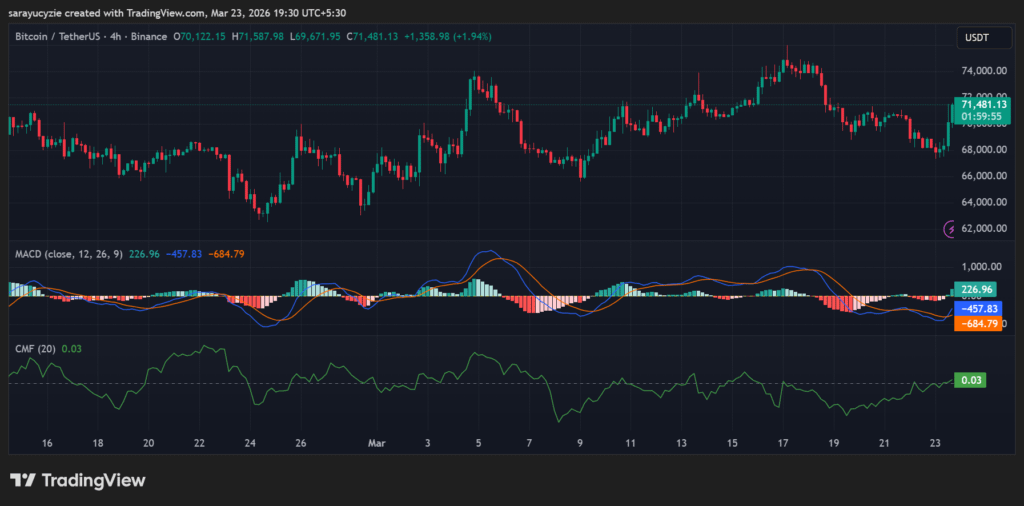
Additionally, the Chaikin Money Flow (CMF) indicator at 0.03 indicates slight buying pressure in the Bitcoin market. More money is flowing in, but it's not strong. Buyers have a slight advantage; however, the market remains hesitant. This suggests sideways movement with a slight upward bias unless buying strength increases.
The daily Relative Strength Index (RSI) at 60.51 indicates that Bitcoin sentiment is leaning towards bullishness. Buyers have a clear advantage, and the price is moving upward with steady momentum. There is still enough room to continue moving, unless the price starts to approach 70.
The value of the buying and selling power of Bitcoin (BBP) at 2,528.10 indicates very strong bullish dominance, pushing the price above its average level. This reflects strong upward momentum. The market is witnessing a notable rise, although these high readings may likely lead to short-term pullbacks.$KAT

