Many see Japanese candles as simple colors:
green = up, red = down.
And that's where they get trapped.
Because a candle is not a drawing…
it's a compressed story of what happened between buyers and sellers.
💡 What is a candle really?
Each candle shows you 4 things:
- Opening (where the price started)
- Close (where it ended)
- High (where the buyers pushed to)
- Low (where the sellers pressed to)
In short:
it's the summary of a battle.
🧱 Basic structure (what you need to master first)
Body → difference between open and close
Wicks (shadows) → price rejections
💡 A long wick = someone tried to dominate… and failed.
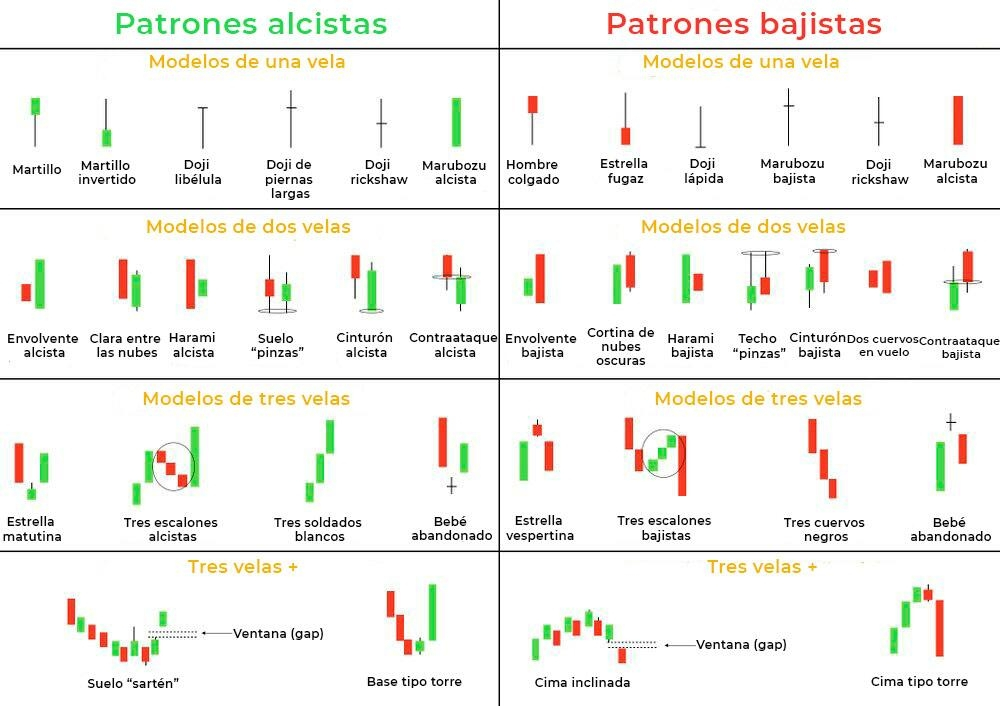
📊 Most important candle types (the ones you should learn)
🔹 1. Hammer
Small body up + long wick down
- The price fell hard… but was rejected
- Buyers entered with strength
- Usually appears at bottoms
🔻 2. Hanging Man
Just like the hammer… but at the top
- Signal of weakness after a rise
⚖️ 3. Doji (total indecision)
- Almost nonexistent body
- No one is in control
- Market on pause
Here you don't enter… you observe
🚀 4. Bullish Engulfing
A large green candle that 'swallows' the previous red one
- Clear control change
- Buyers dominate
📉 5. Bearish Engulfing
The opposite
- Sellers take control
🔥 6. Shooting Star
Small body down + long wick up
- they tried to rise… and they were brought down hard
- Signal of possible drop
⚠️ The mistake that makes you lose money
Believing that a candle by itself means something.
No.
An isolated candle is noise.
A pattern in context… is information.
🧠 Here is where it gets interesting
Candles work better when you combine them with:
- Supports and resistances
- Market trend
- Volume
💡 Example:
A hammer in the middle of nowhere → irrelevant
A hammer at strong support → opportunity
🔥 Patterns (when several candles speak together)
Here you are already reading the market:
Three white soldiers → strong bullish impulse
Three black crows → clear bearish pressure
Inside bar → compression before movement
⚡ The truth that no one tells you
Candles do not predict the future.
They show you probabilities.
And trading is not guessing…
is making decisions with an advantage.
🧠 Conclusion:
When you learn candles, you stop seeing charts.
You start to see:
- fear
- pressure
- manipulation
- real intention of the market
And there… is where real trading begins. $PIPPIN $PEPE
Here you can observe it👇🏻


#TradingCommunity #CryptoTrading #educational_post #BTC #PriceActionAnalysis