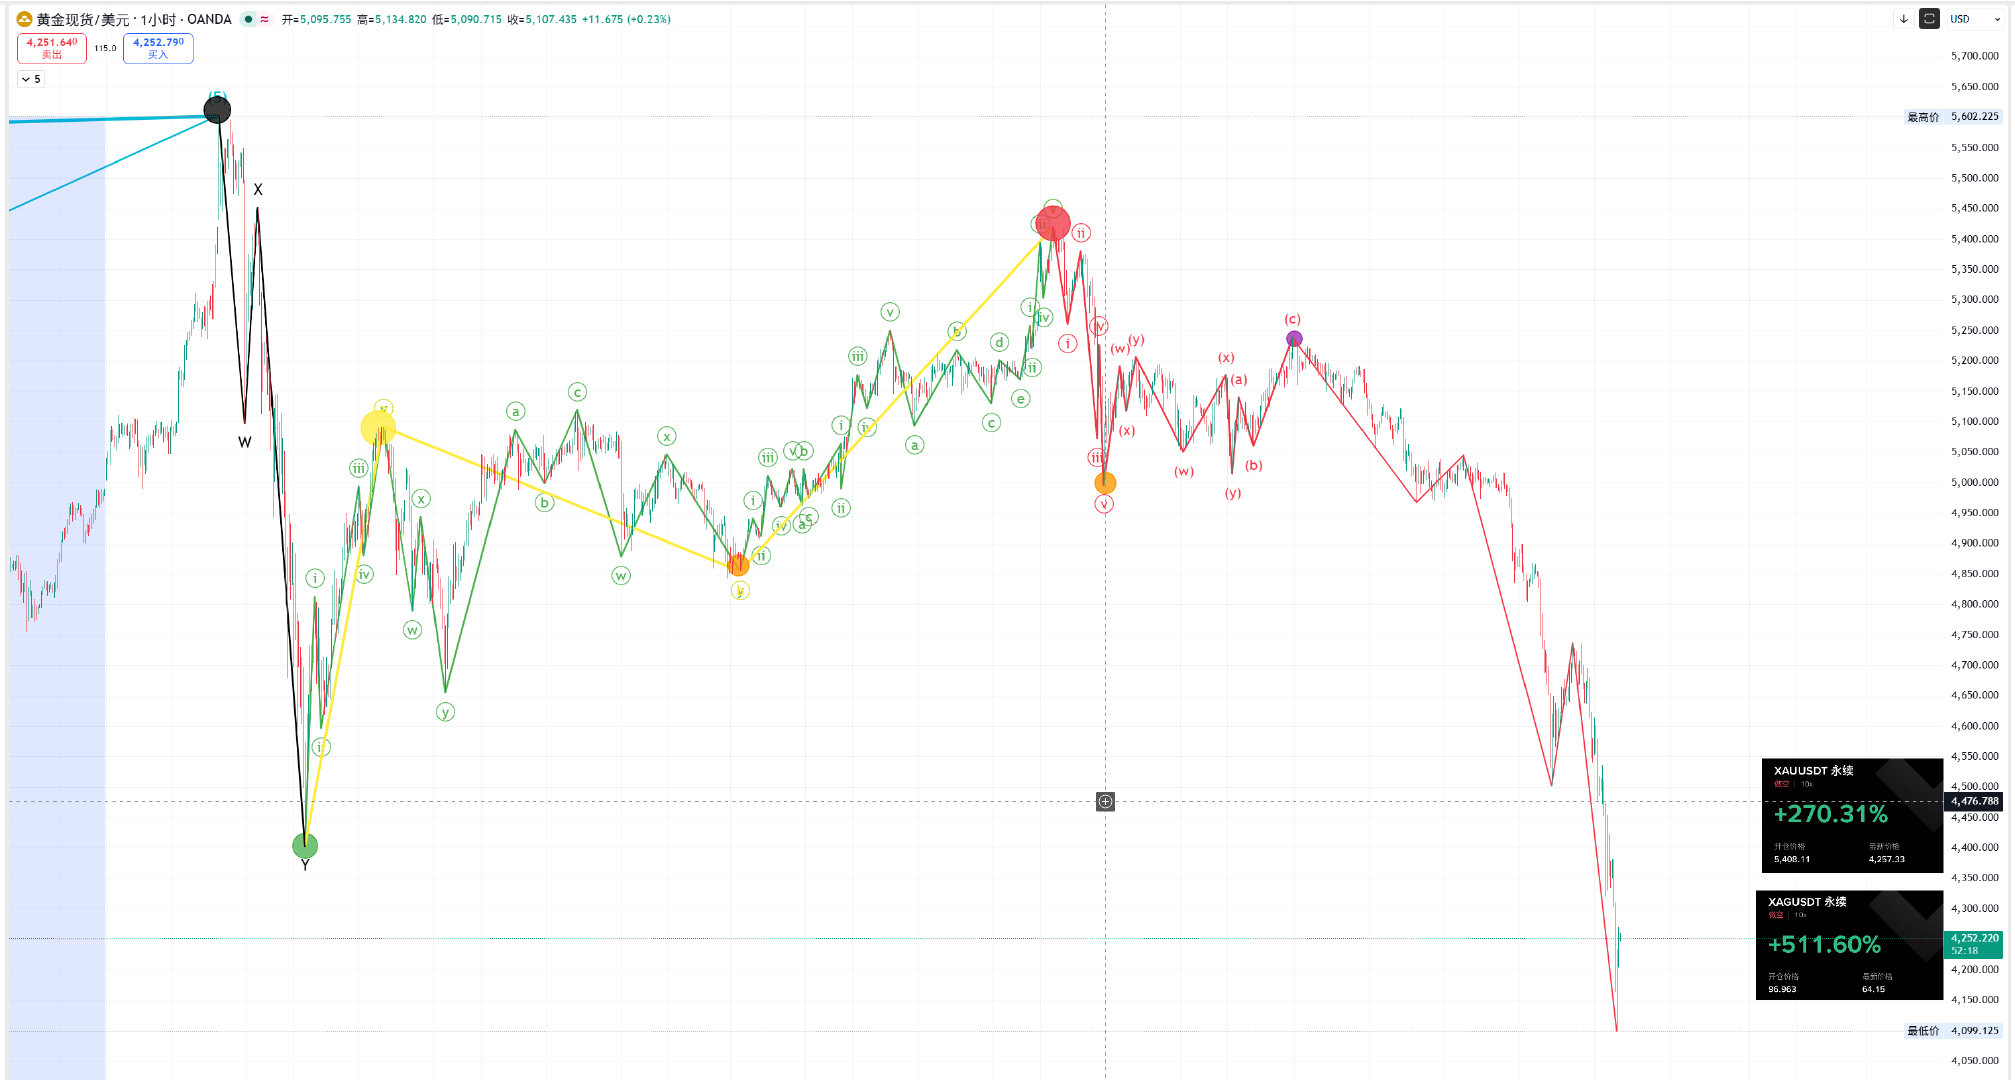
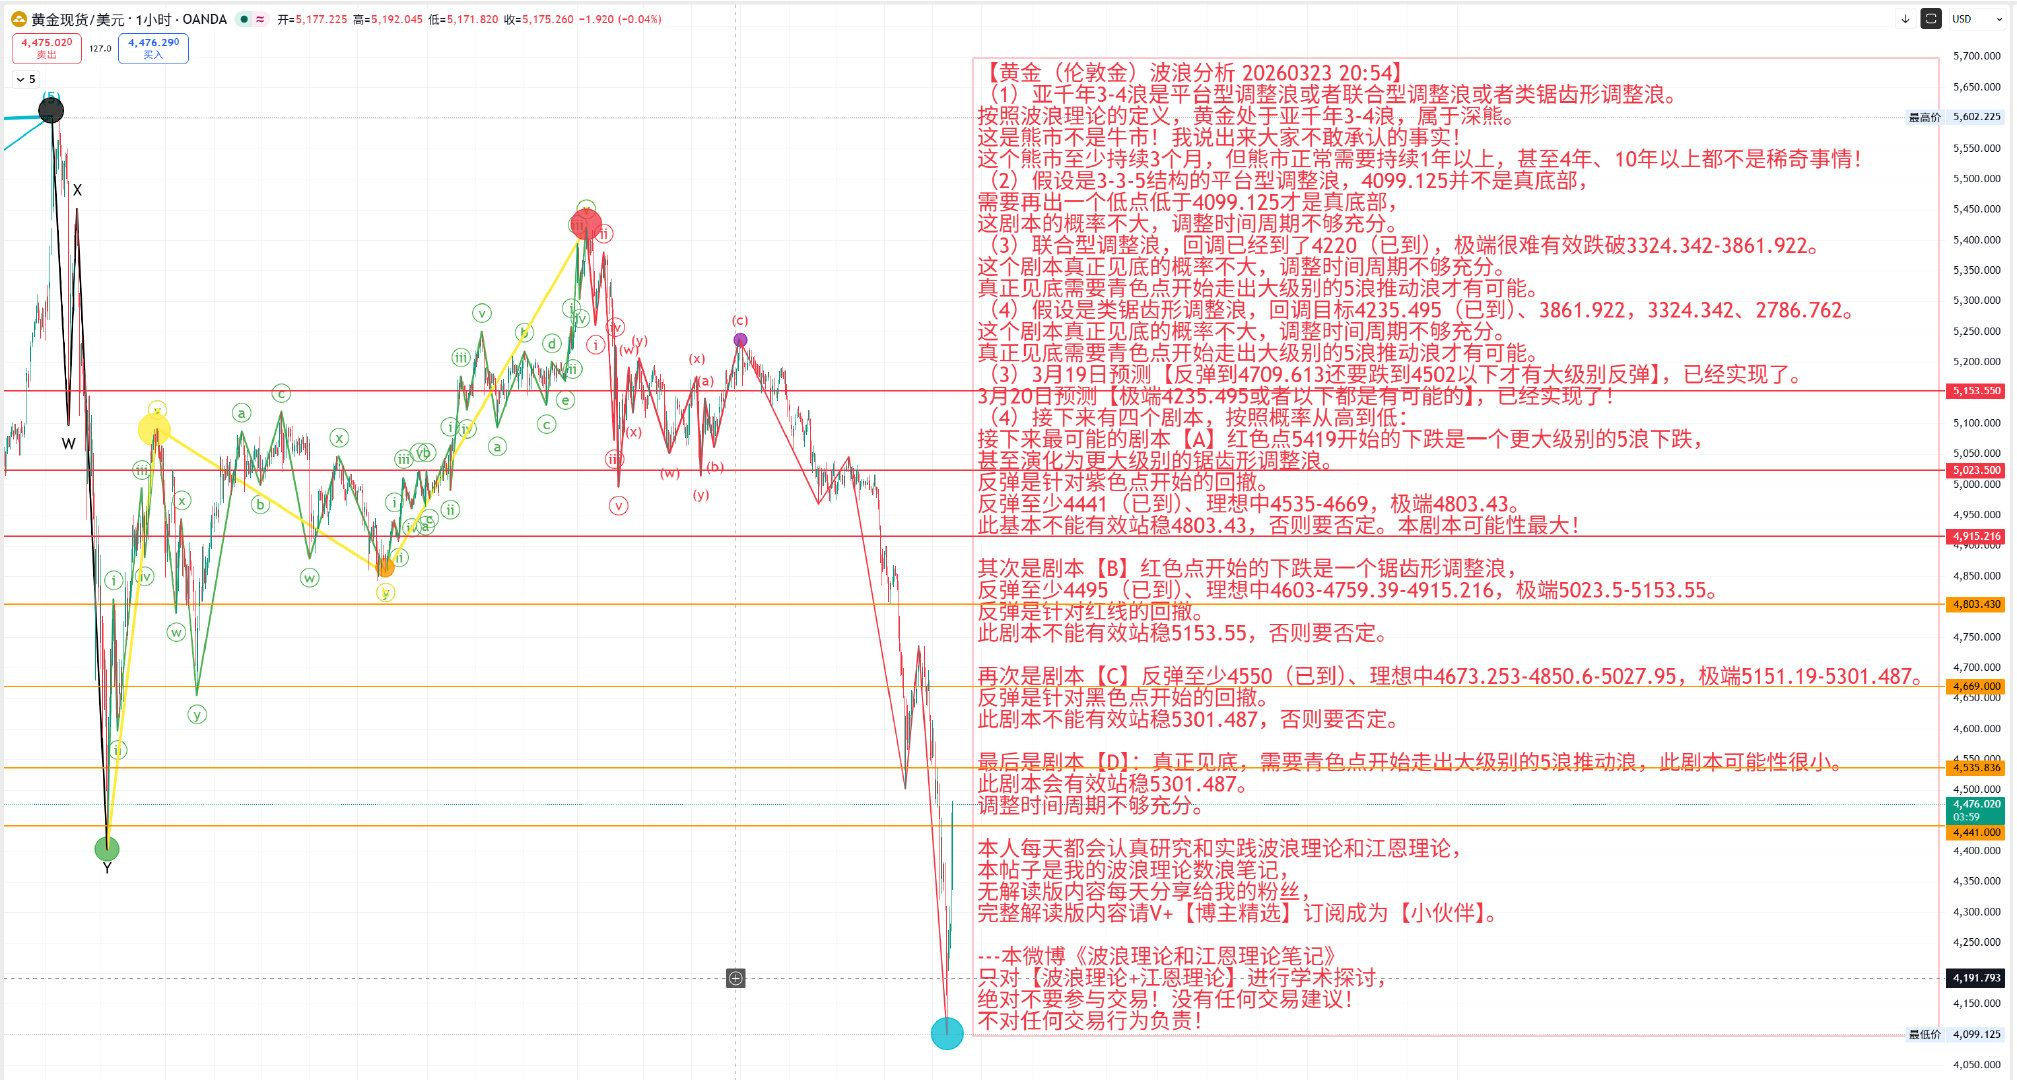
[No one supports your ambitions, A-shares and gold send you to the west! Isn't it ironic?] March 19 forecast [Gold rebounding to 4709.613 needs to drop below 4502 for a significant rebound], has been realized.
March 20 forecast [Gold extreme 4235.495 or below is possible], has been realized!
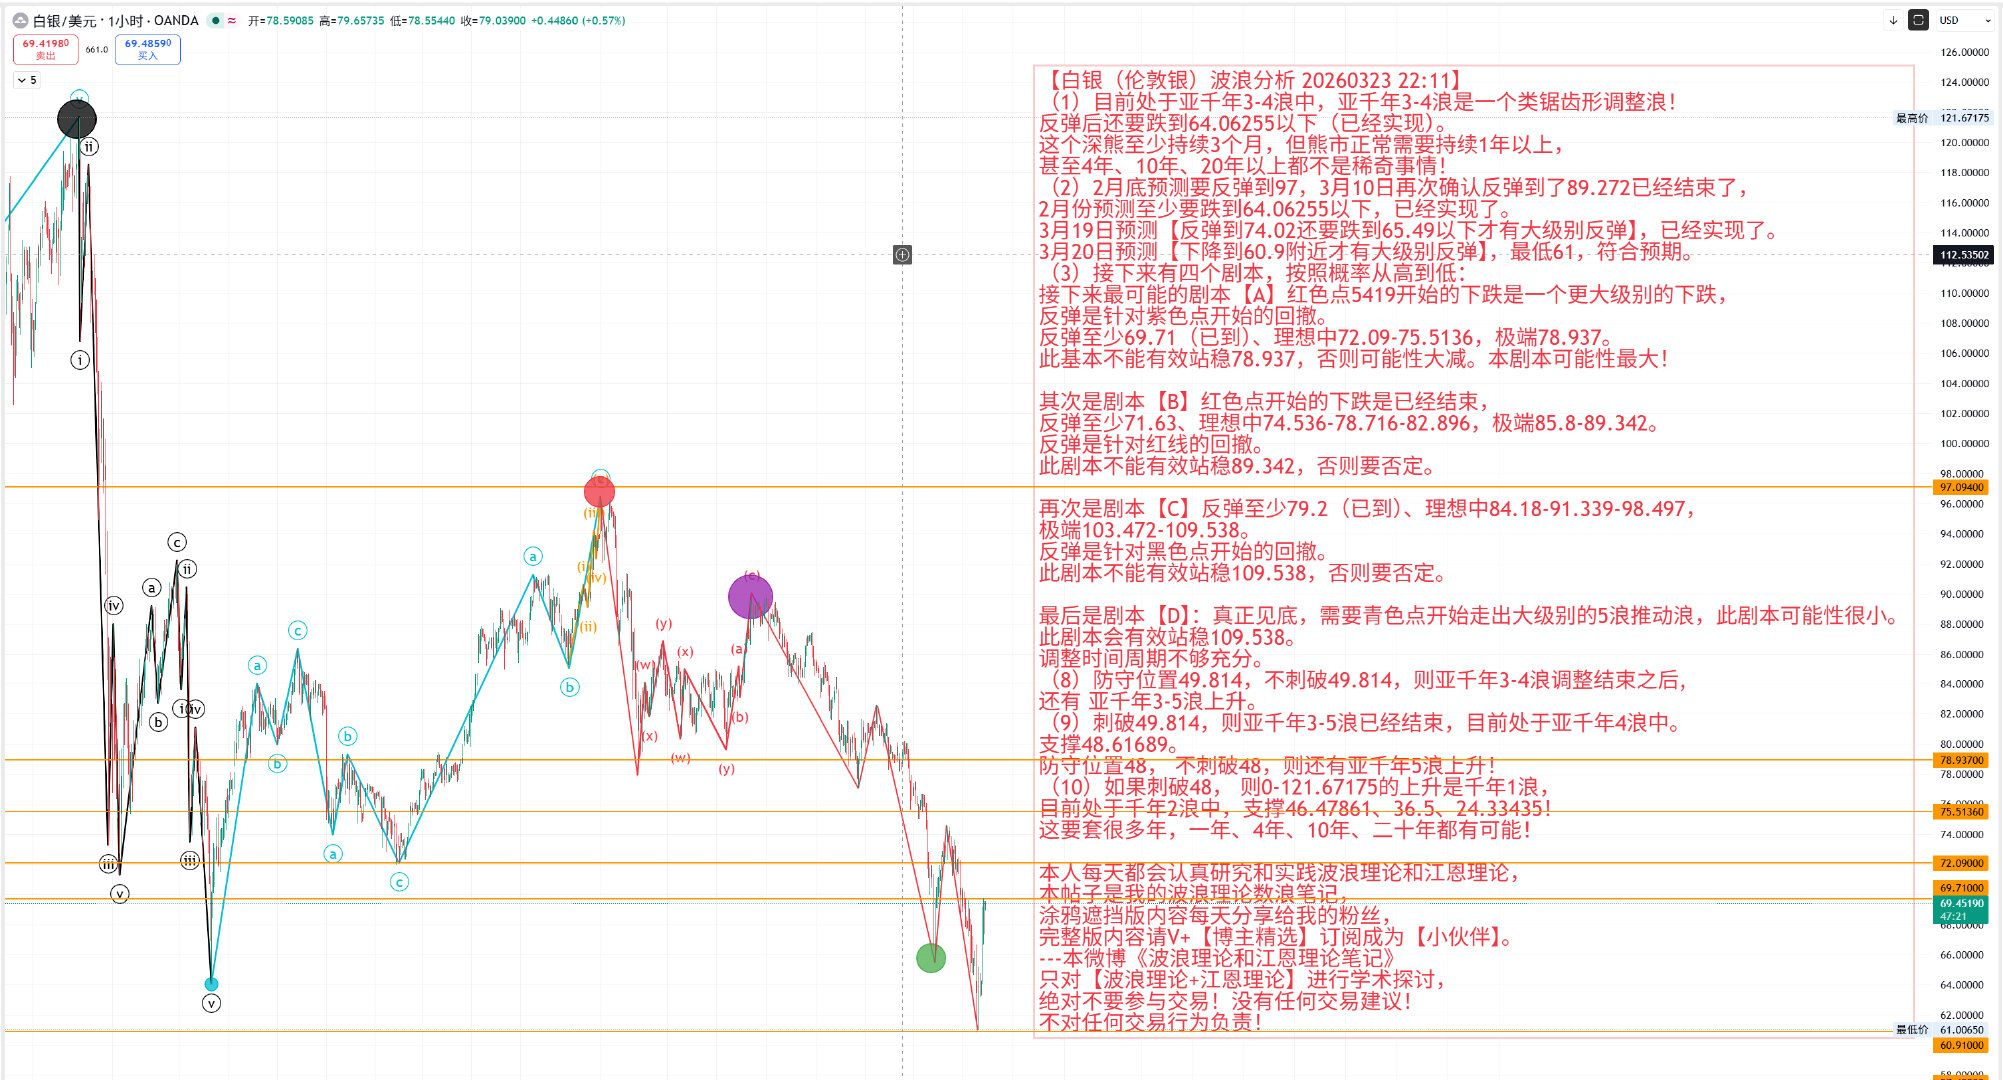
March 19 forecast [Silver rebounding to 74.02 needs to drop below 65.49 for a significant rebound], has been realized.
March 20 forecast [Silver needs to drop to around 60.9 for a significant rebound], with a minimum of 61, meeting expectations.
So have gold and silver completely bottomed out? Where will they rebound to? No rush, take your time!
One, while you are still fantasizing about the bull market, I have long identified the bear market and taken profits!
I really don't understand; the market is clearly deteriorating, why is no one reminding everyone? Some are still encouraging you, saying things like resilience and positive trends. If you believe this, you're in trouble; I've reminded countless times. Today is March 23, and I'm telling everyone again, hurry and hide. The recent news is all red warning lights.

(1) [BTC Bitcoin $BTC ]

] Last September, I used a four-year cycle to predict that October 6 would be the peak of the bull market! On October 5-7 of last year, I again emphasized the [Peter Index Bull-Bear Conversion Chart], confirming once again that October 6 is indeed the peak of the bull market!
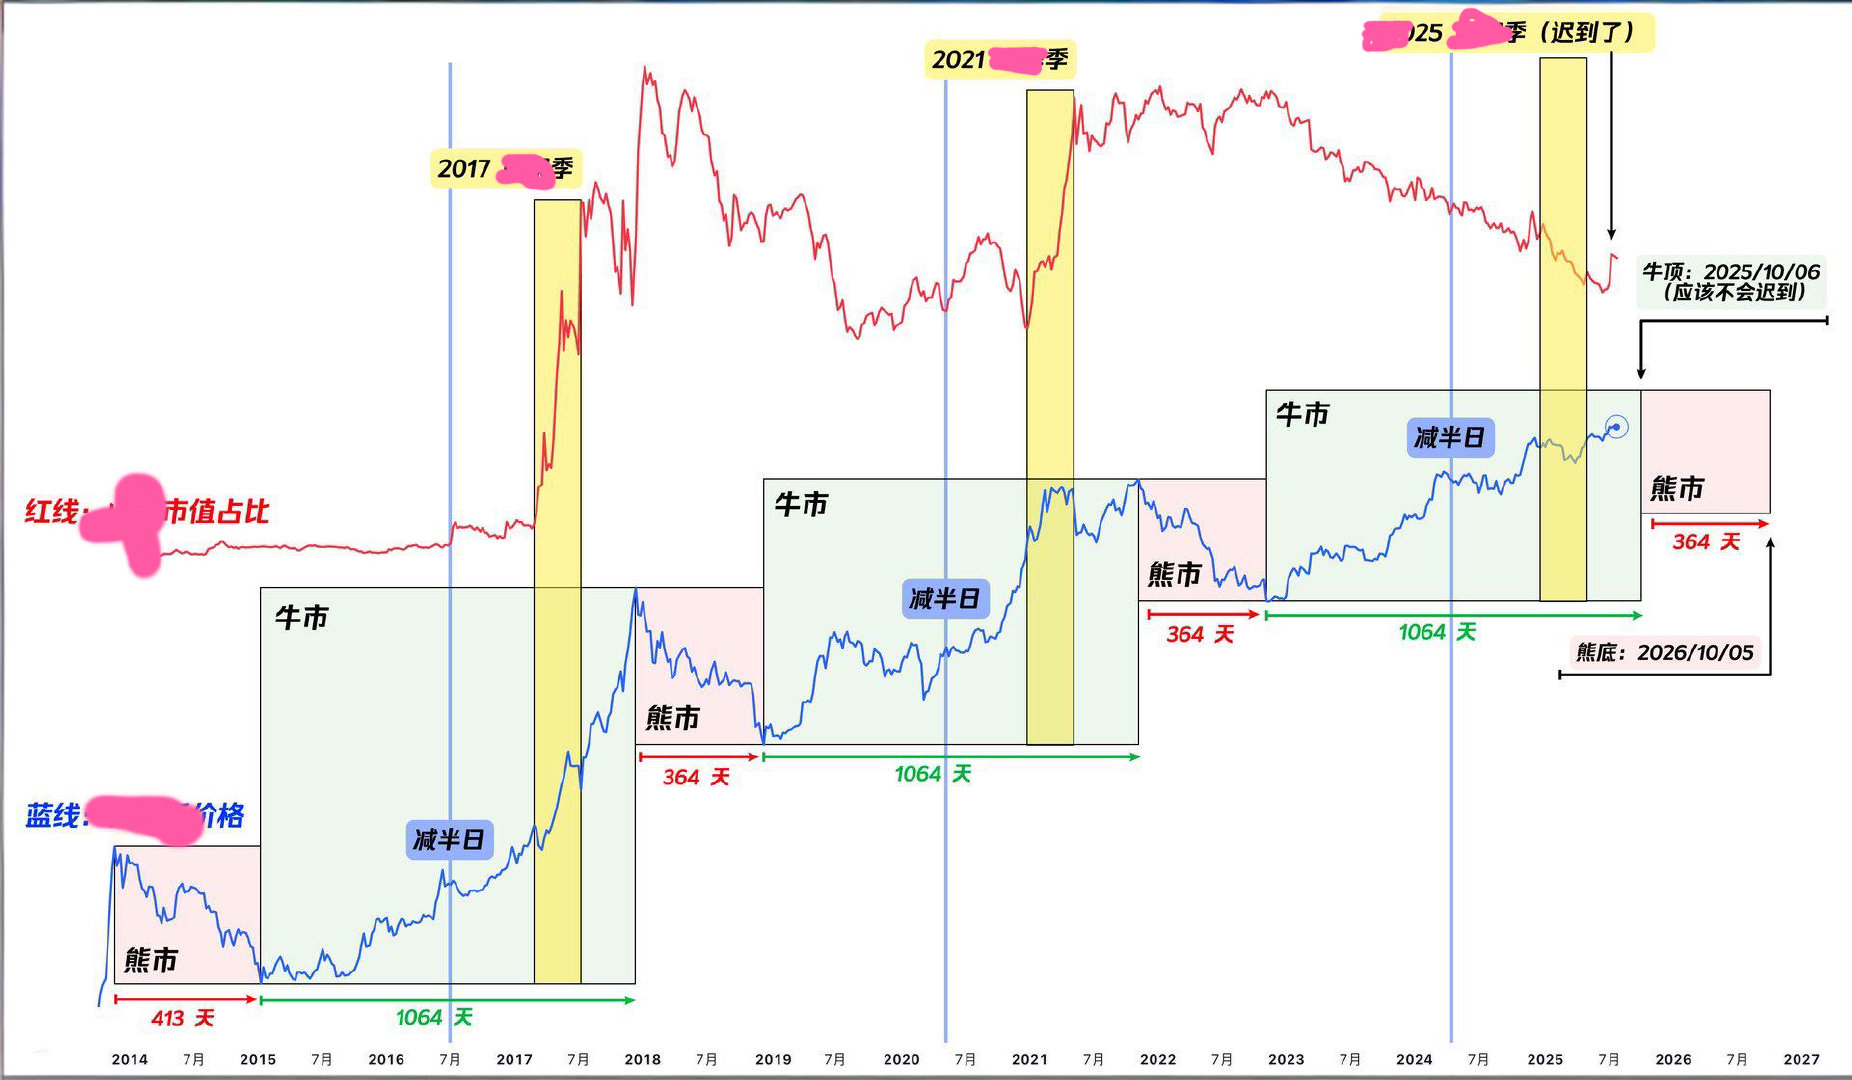
When many speculators fantasize about new highs, October 6, 2025, became the peak of the bull market without any deviation, and the bear market officially arrived! I also shorted [btc Bitcoin], [eth Ethereum $ETH ] at 120000-125000, 4700, and 4950.

] and [SOl $SOL

]!
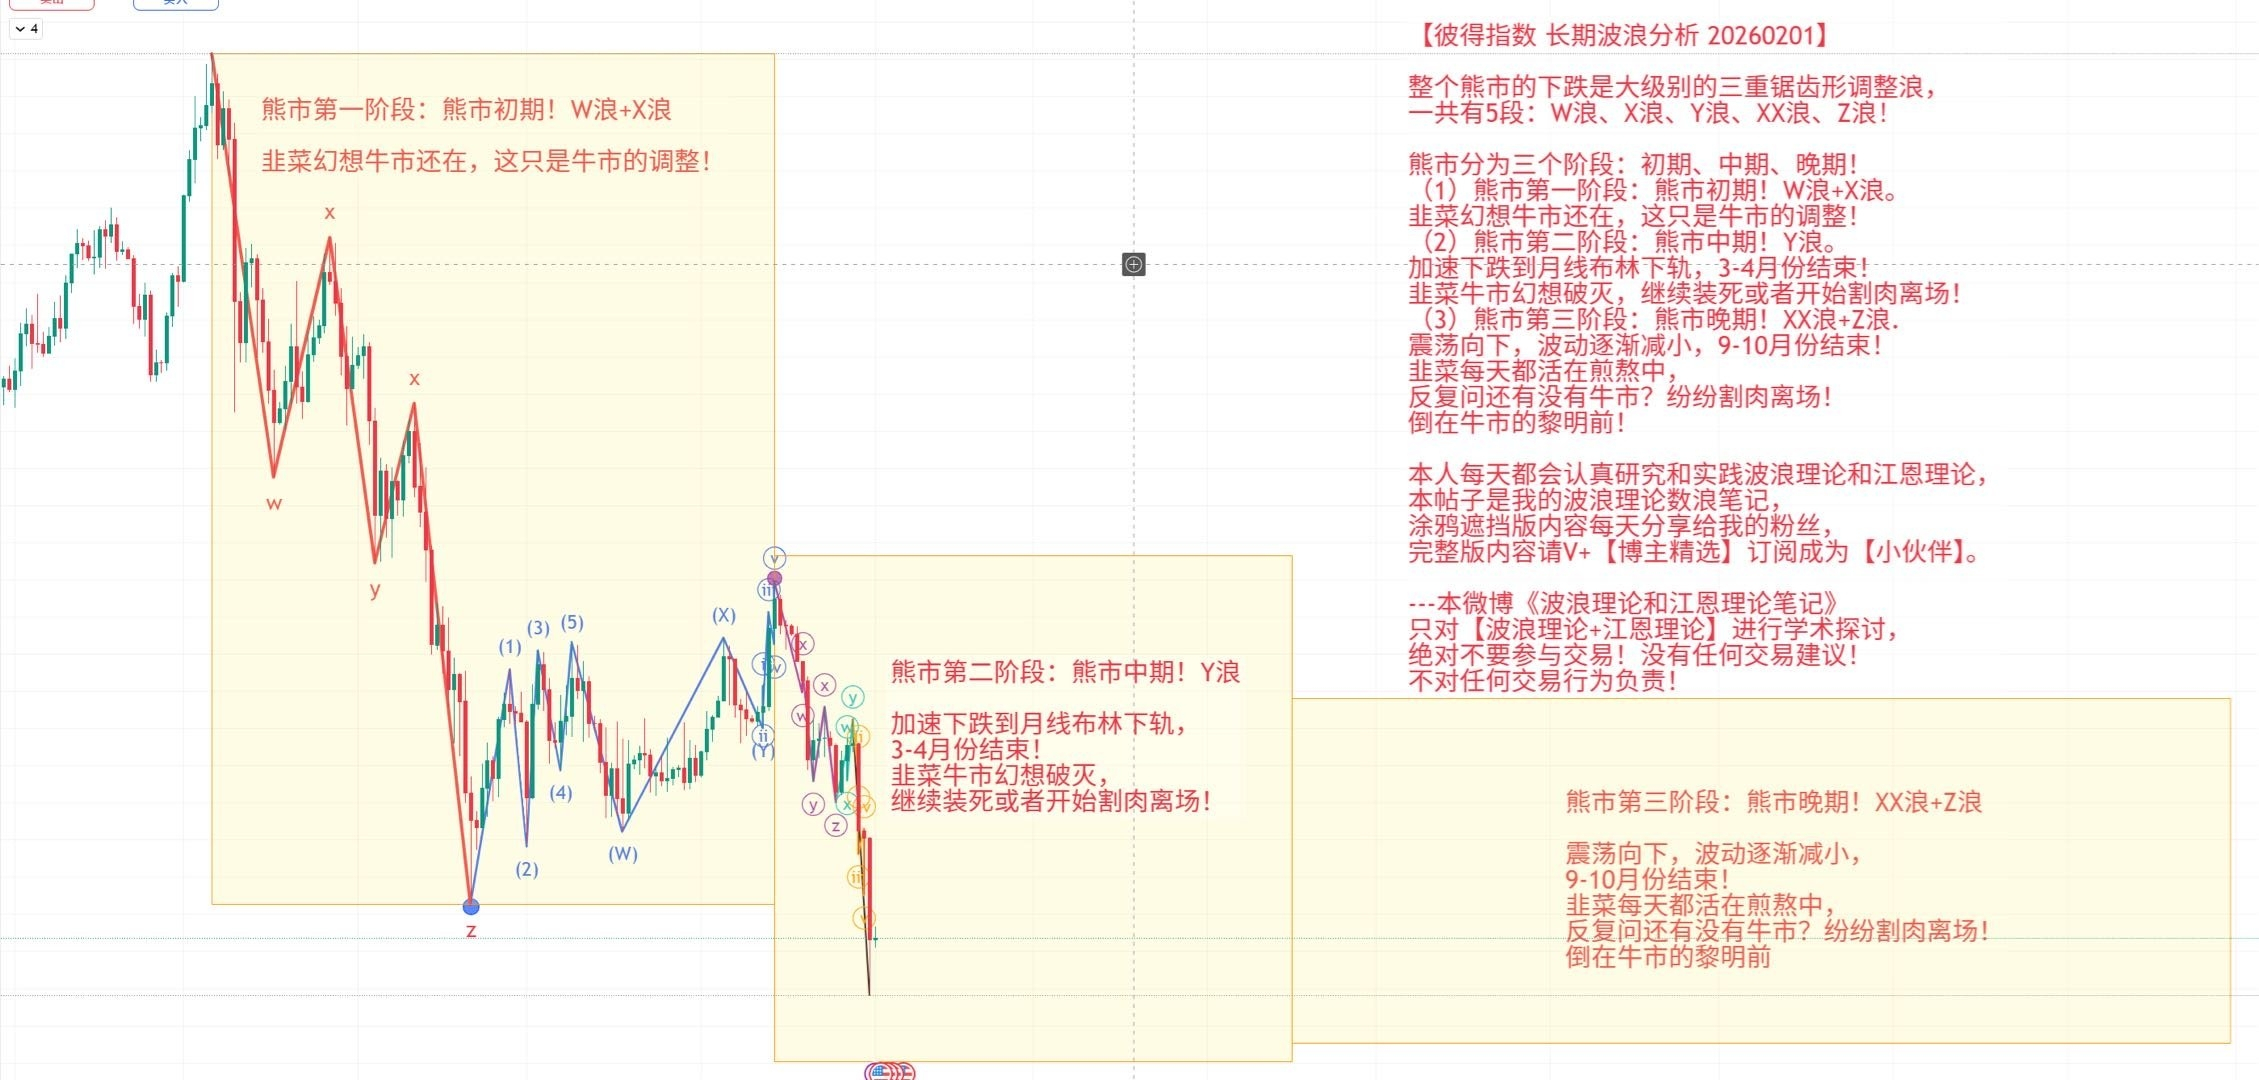
On February 1, I divided the bear market of [btc] into three stages: early bear market, mid-bear market, and late bear market!
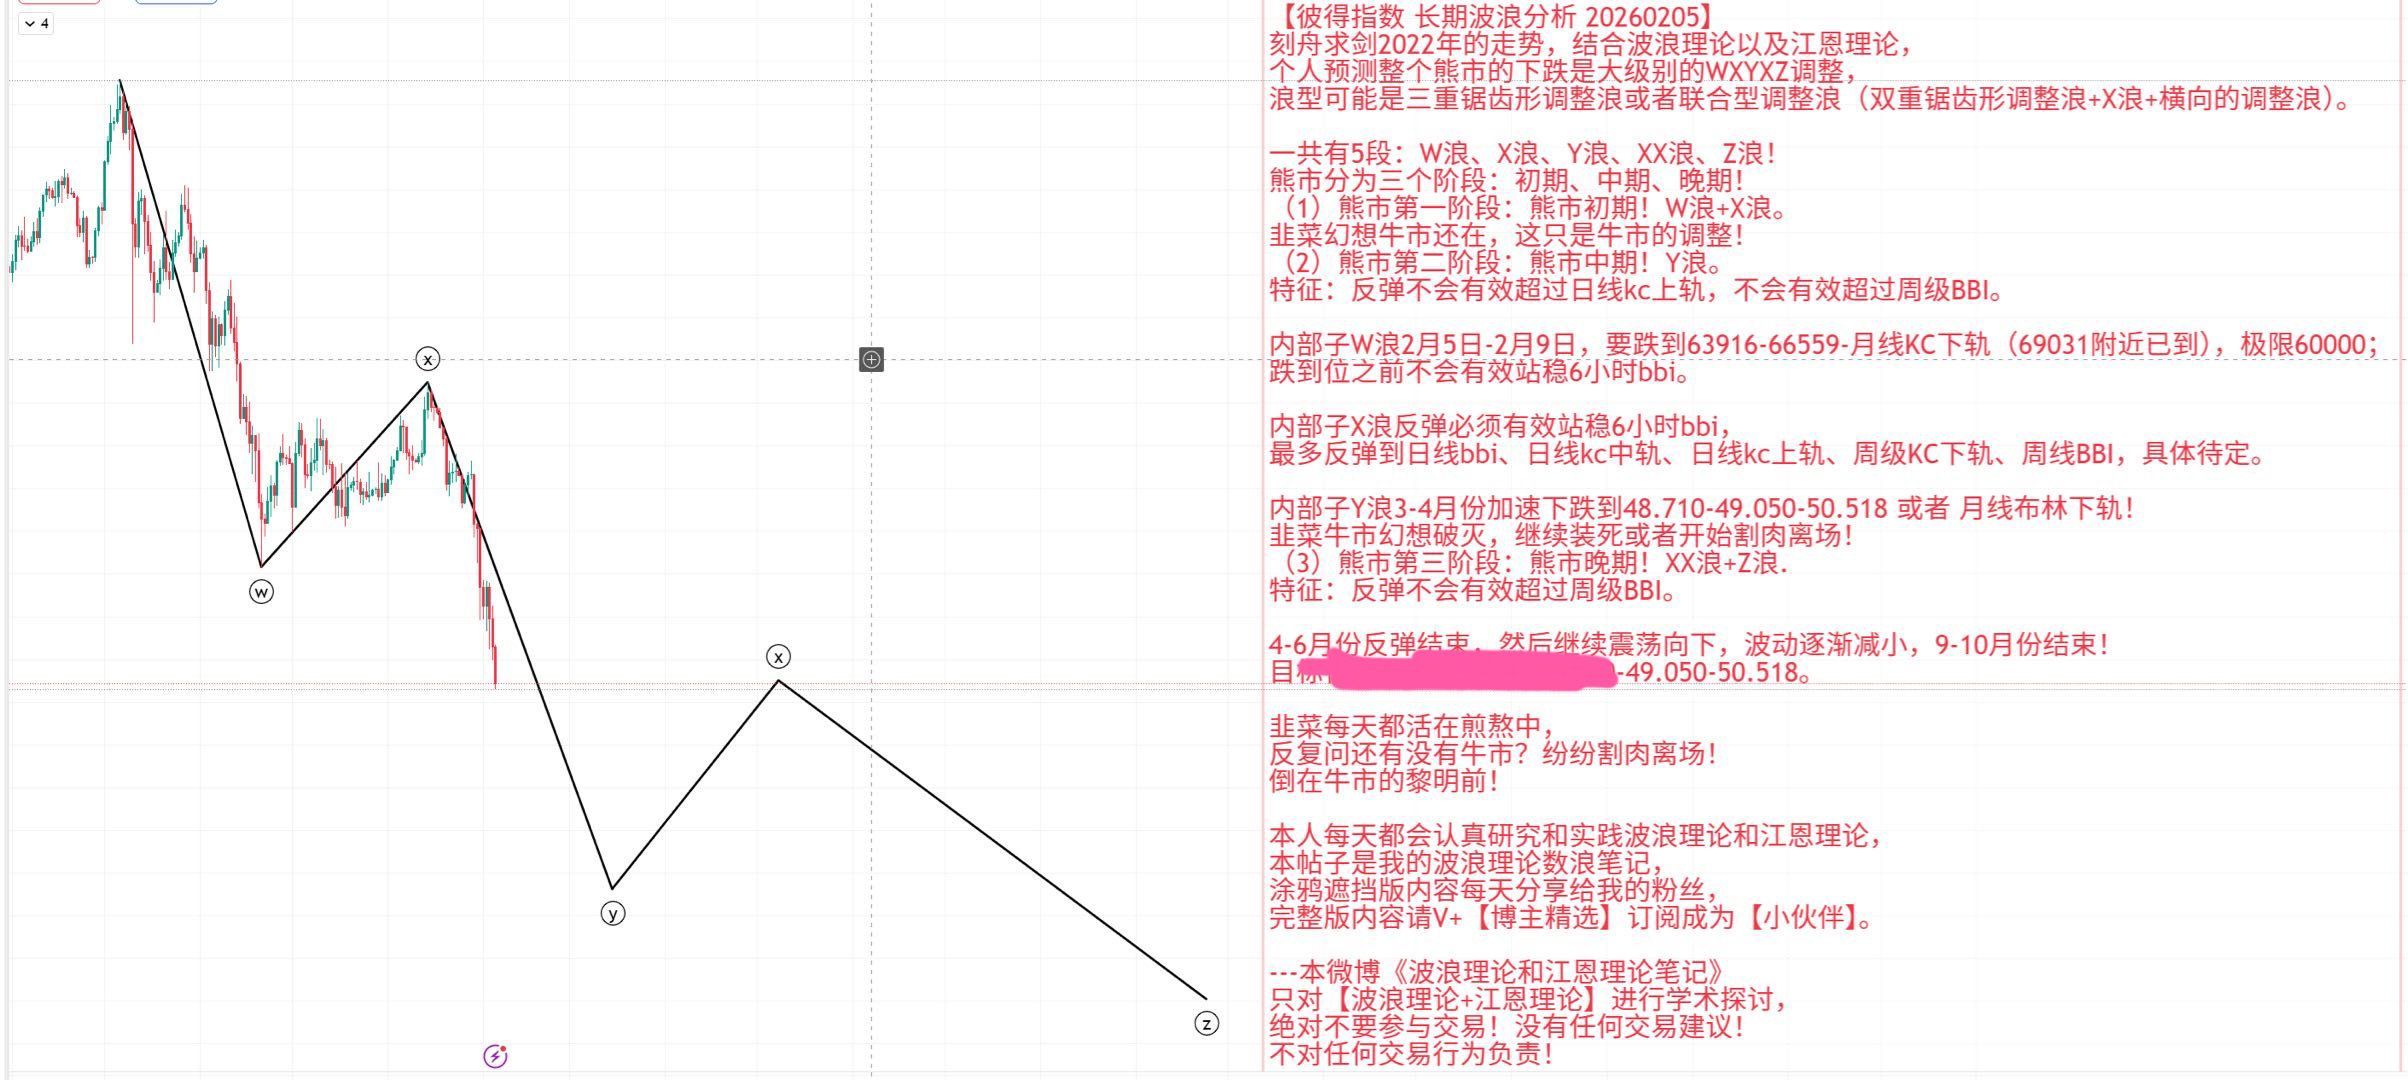
On February 5, my long-term analysis chart for [BTC] has been running according to my predictions for the past month and a half!
(2) [Gold], [Silver] reminded at the end of January that a peak would appear around 5378 and 118.2, and it actually appeared around 5600. At the end of February, I predicted it would rise to the secondary peak at 5400 and 97, with another peak appearing on the first trading day of March.
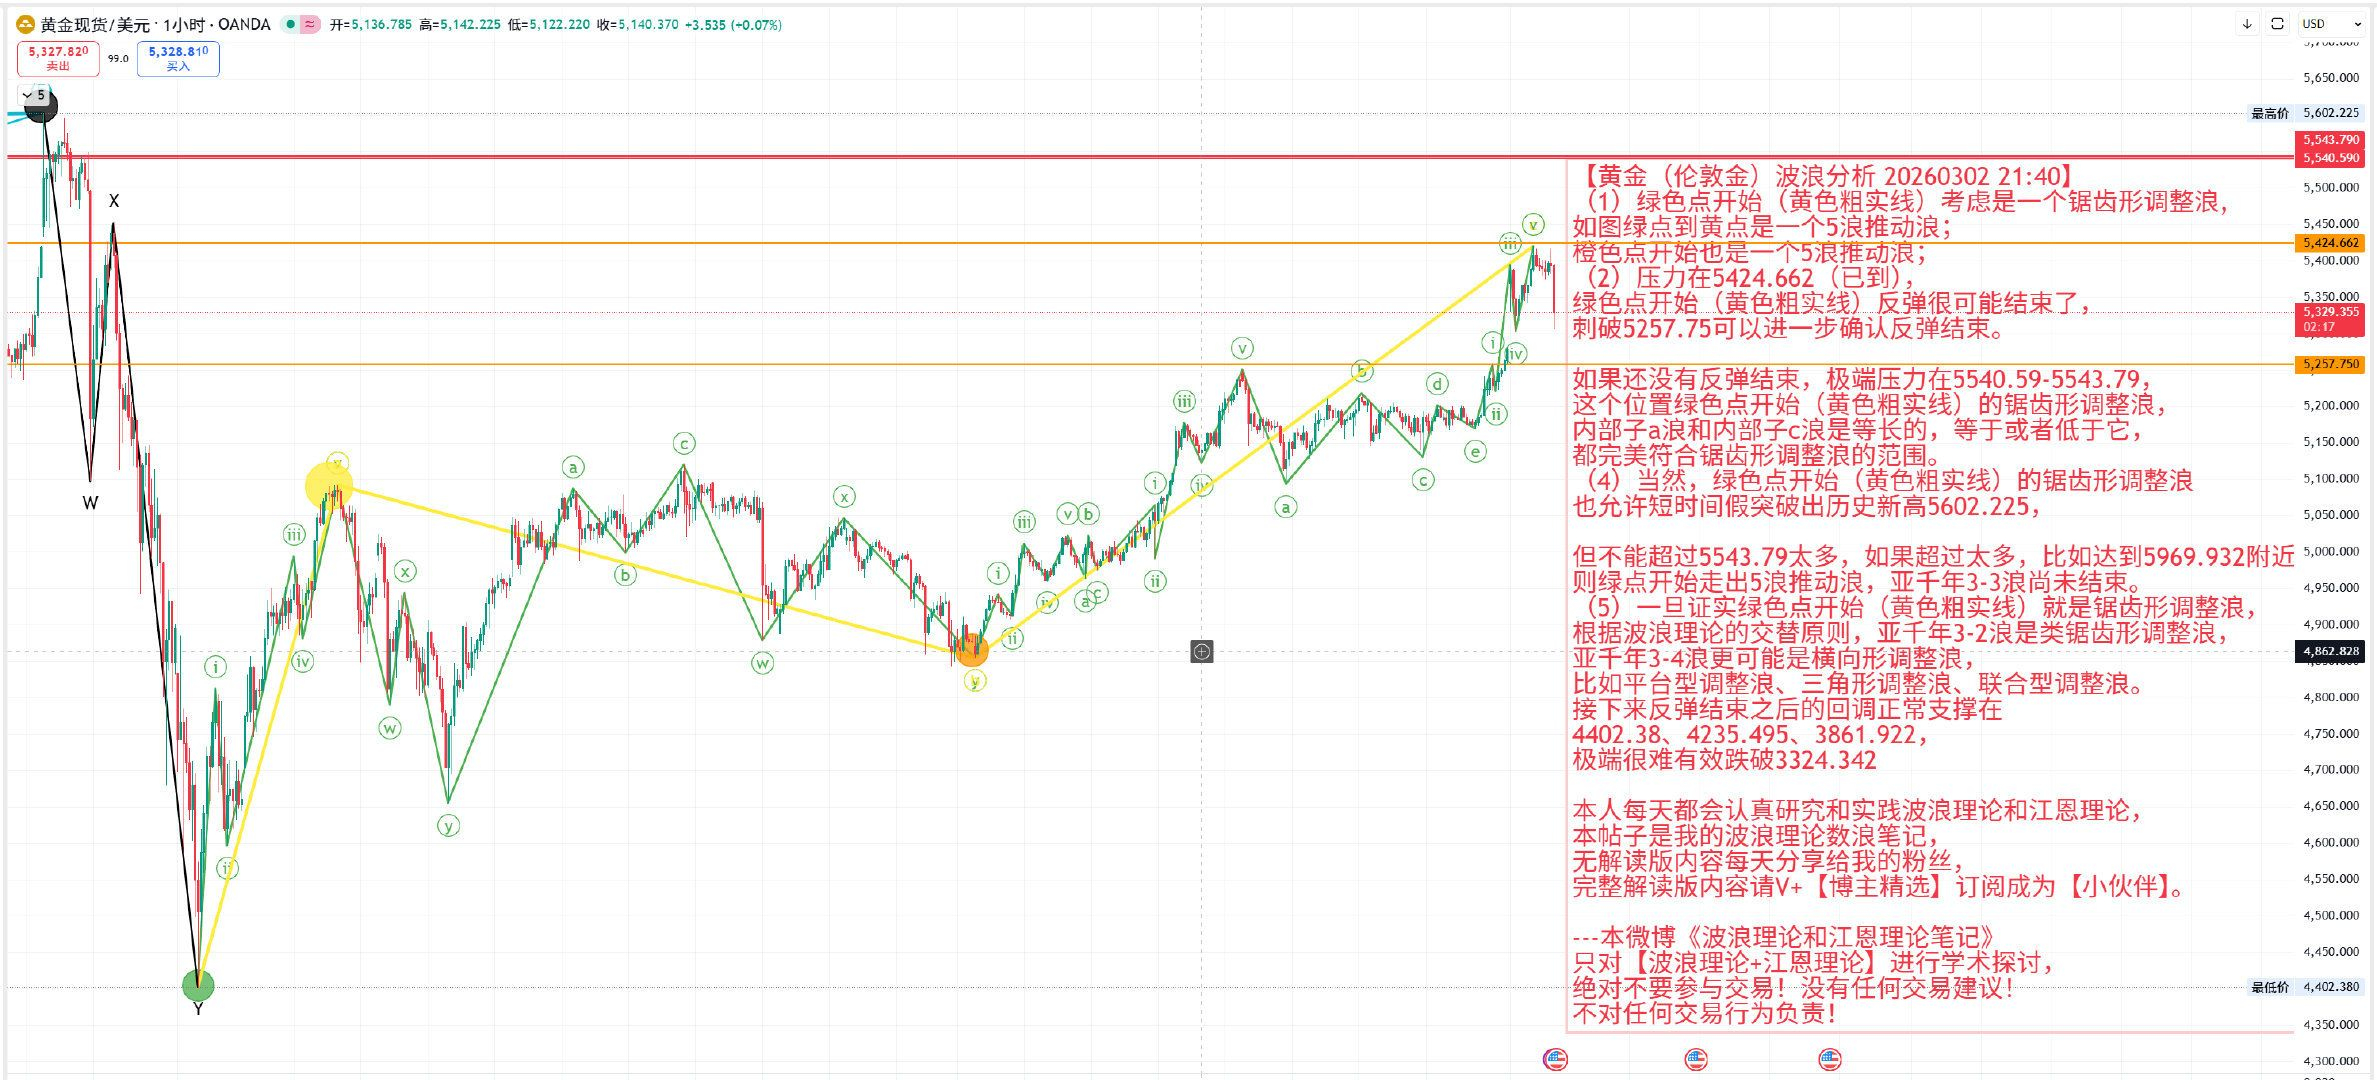
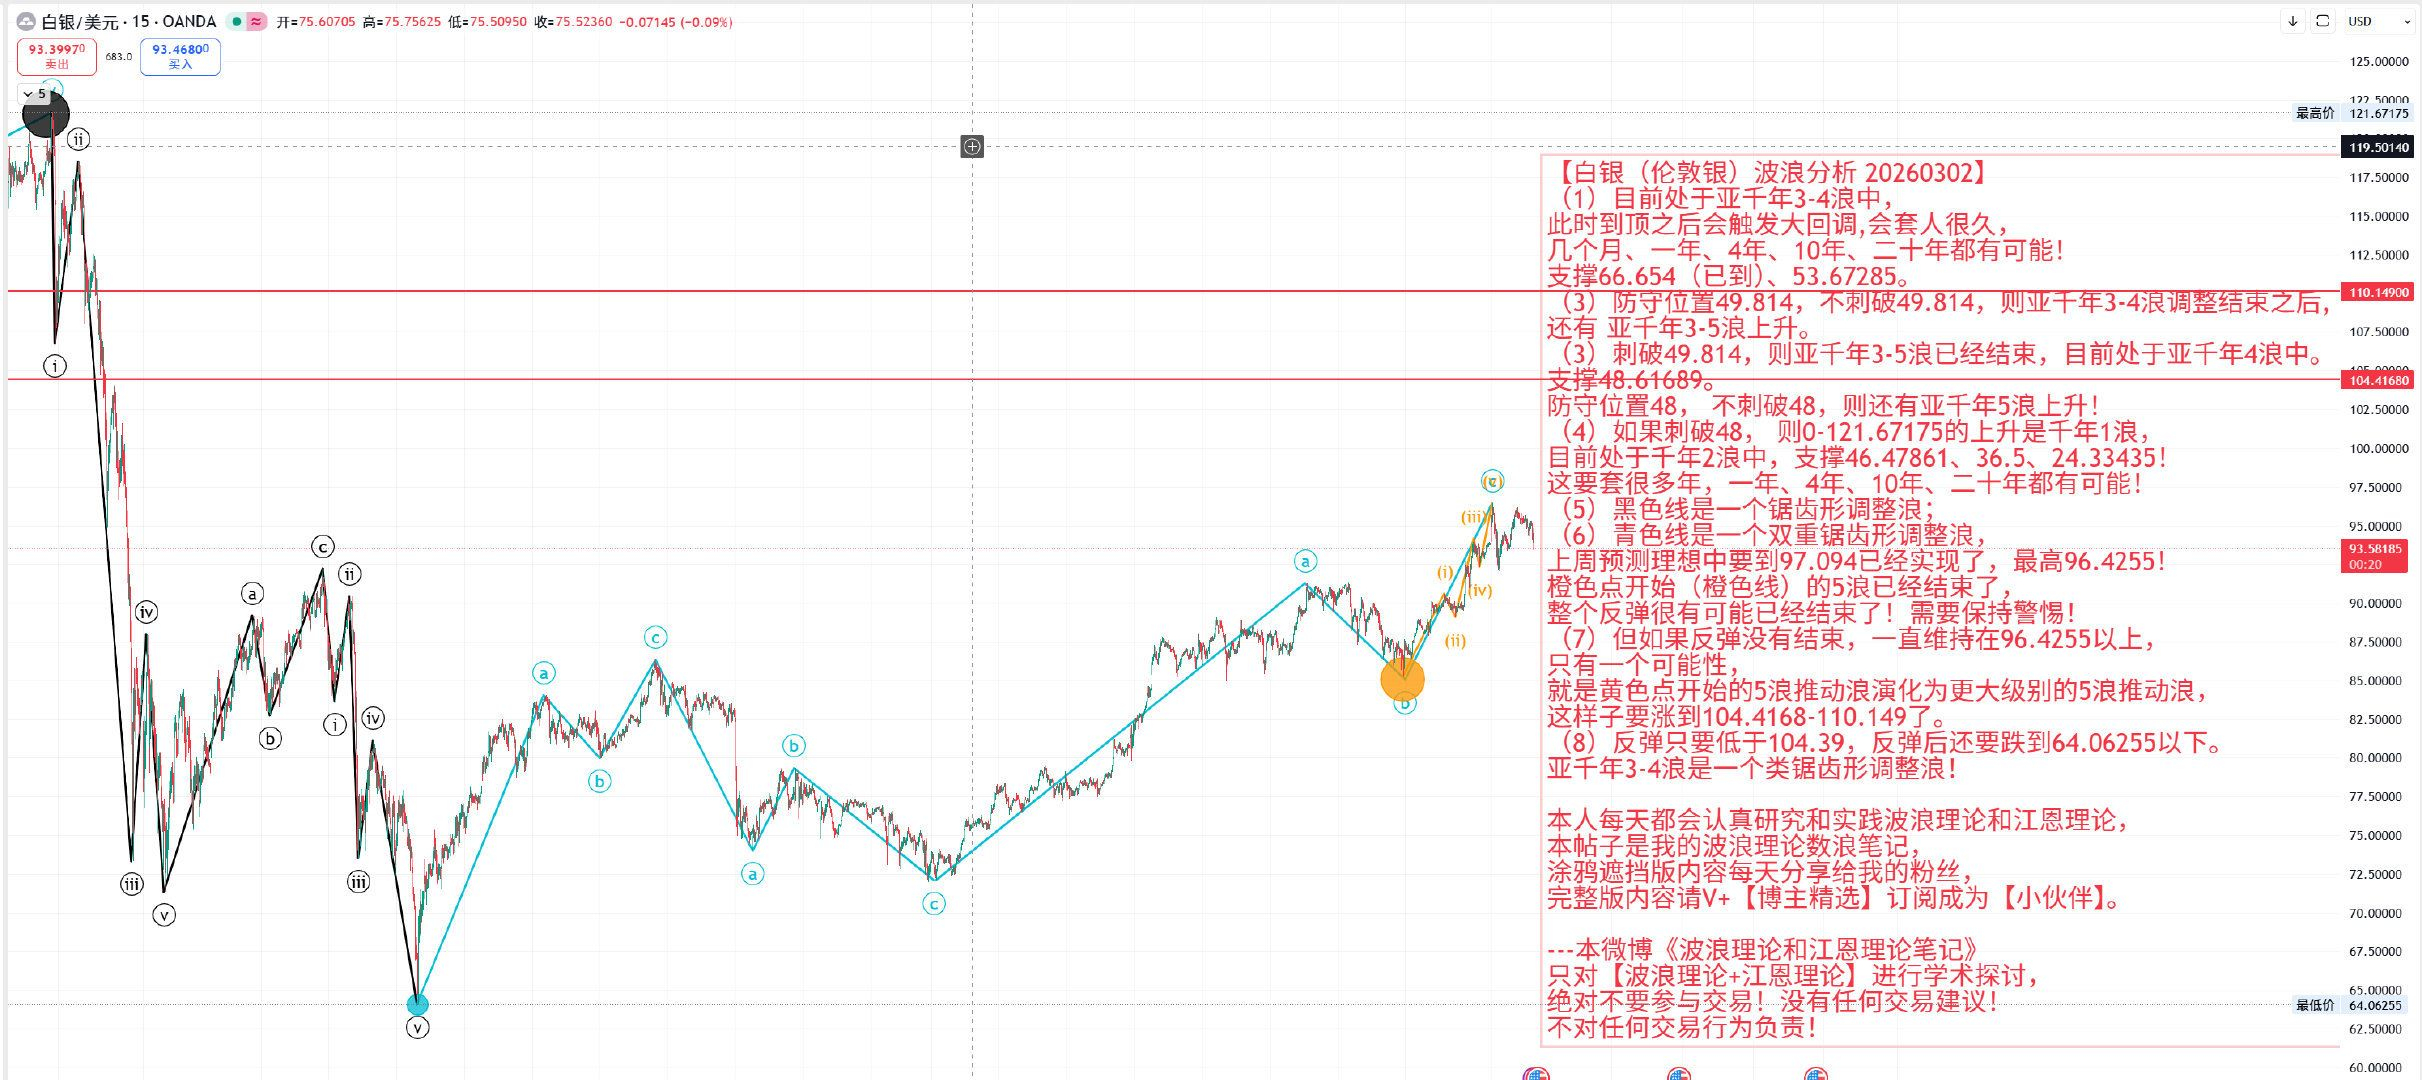
On March 2, when many speculators were fantasizing about 6000, [Gold] and [Big Not Falling Silver] appeared in silver. I violently attacked [Gold] at 5400 and [Silver] at 97! The bear market confirmation for [Gold] and [Silver] has arrived!
(3) [A-share Shanghai Composite Index] On February 24, I analyzed that the external environment deteriorated and was not optimistic! Everyone should lower their expectations! It is necessary to reduce positions and run away, waiting for a golden pit in March-April!
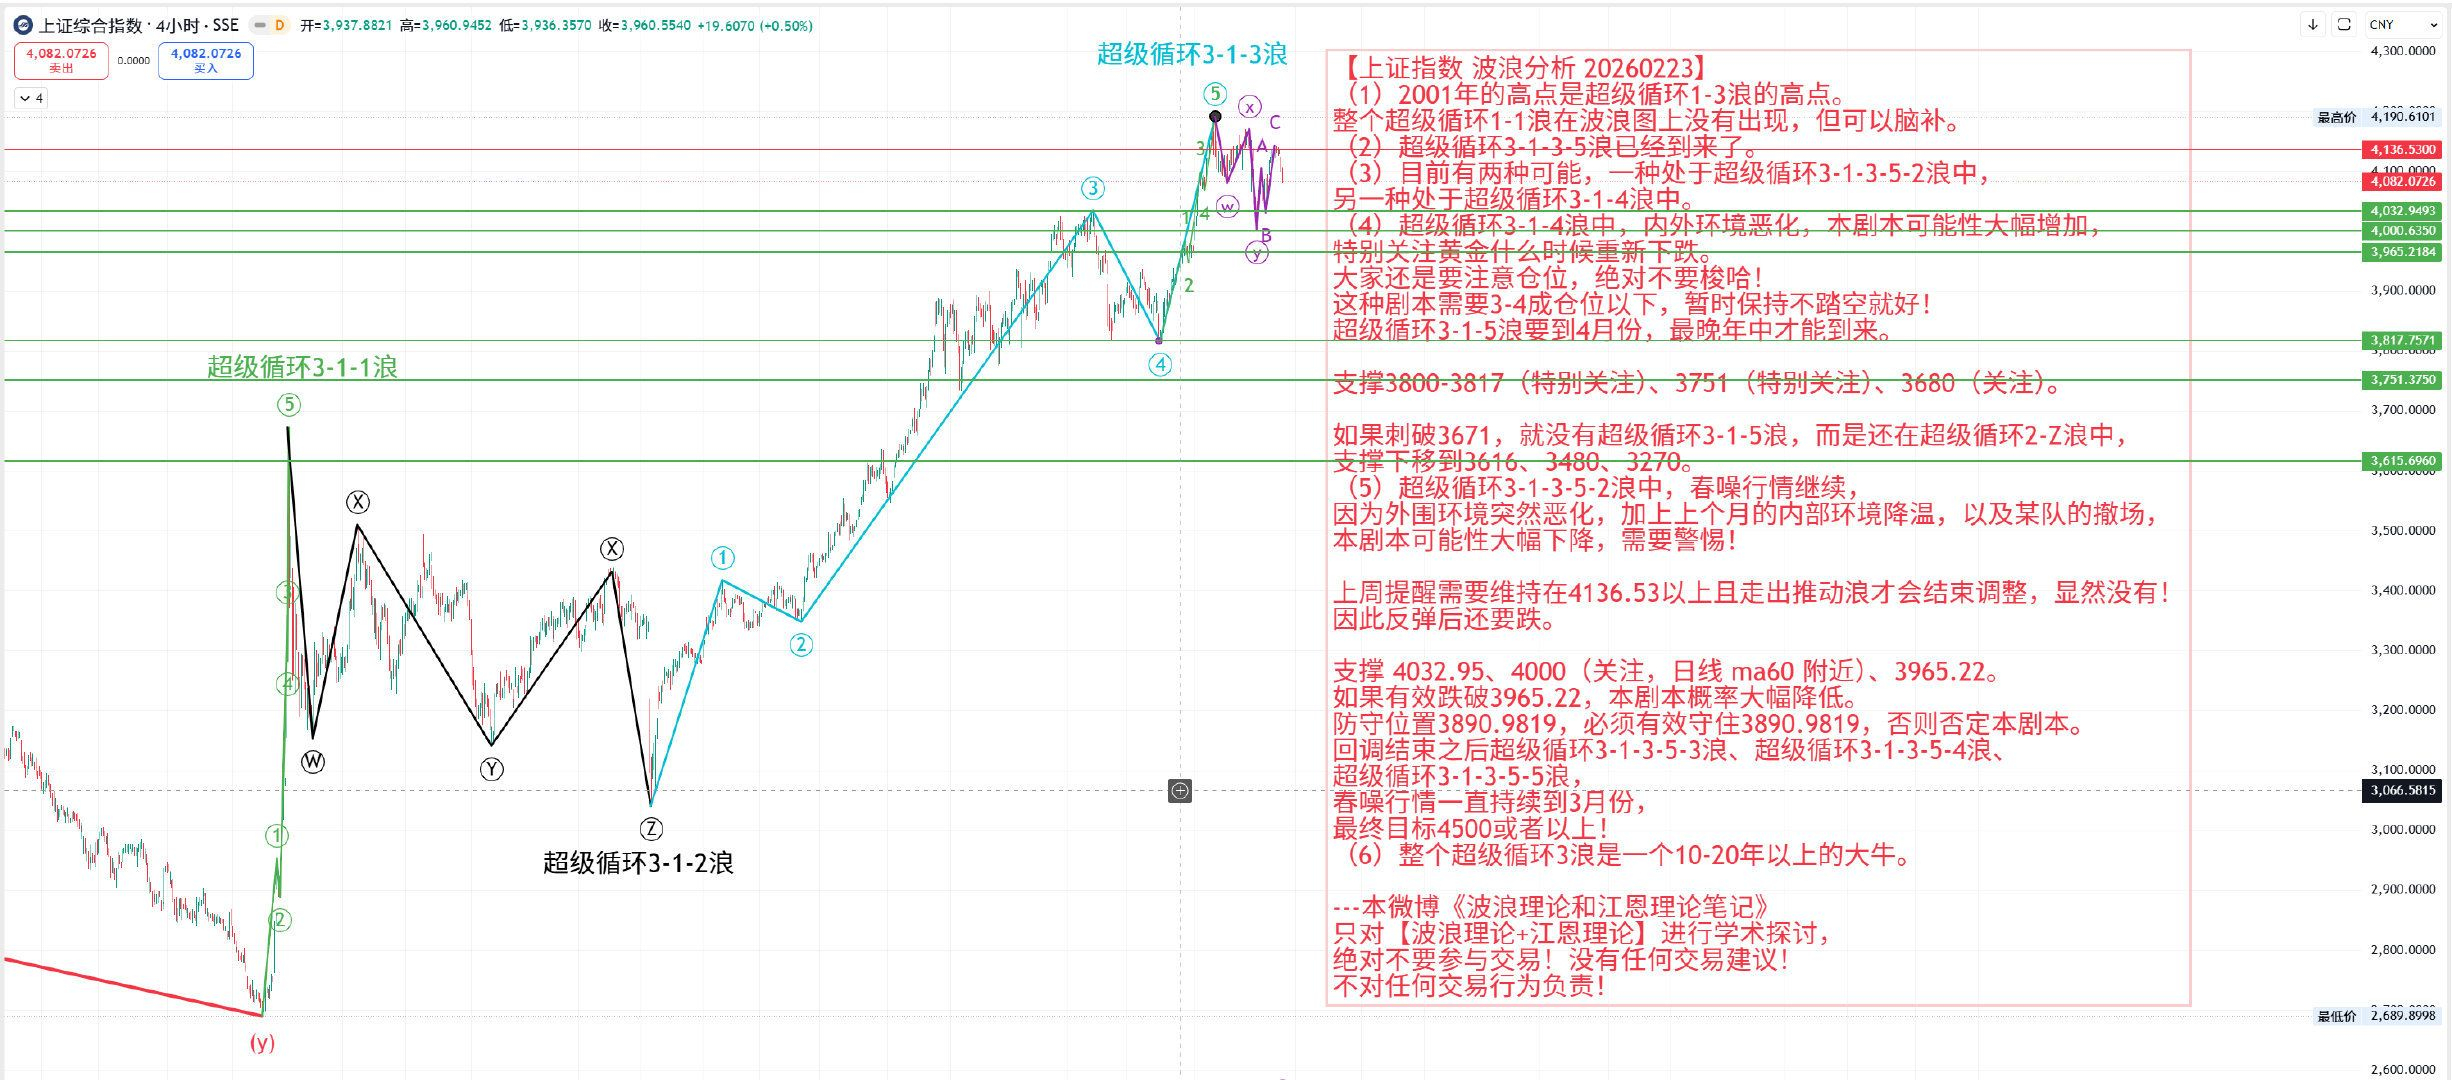
On February 26, I reminded again to take profits on the eighth day of the new year! Many A-share stocks have been declining since the eighth day of the new year! On Friday, it fell below 4000, establishing a mid-bear market!
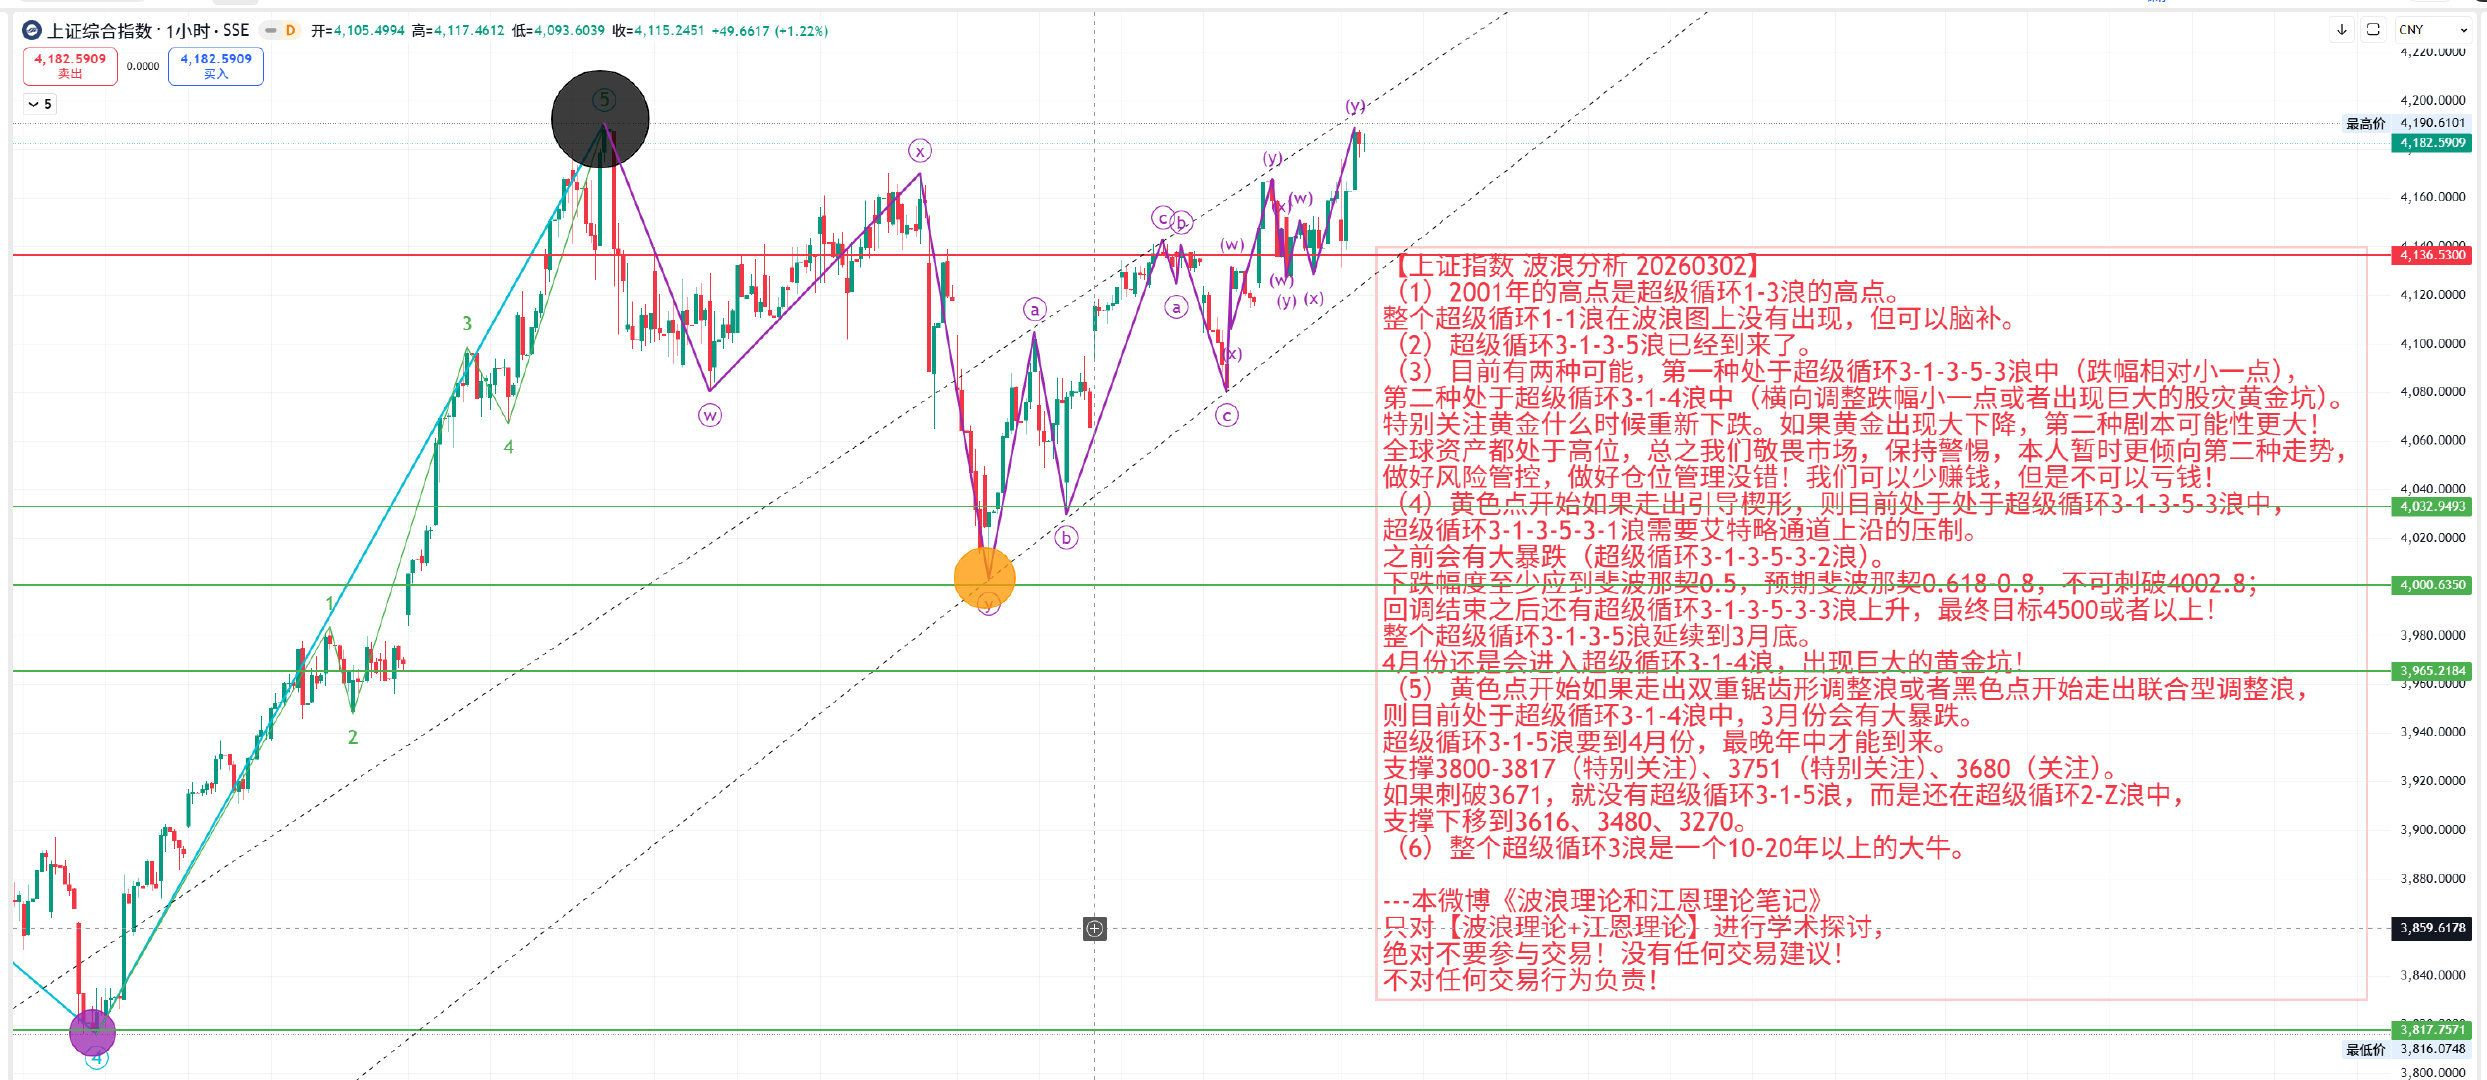
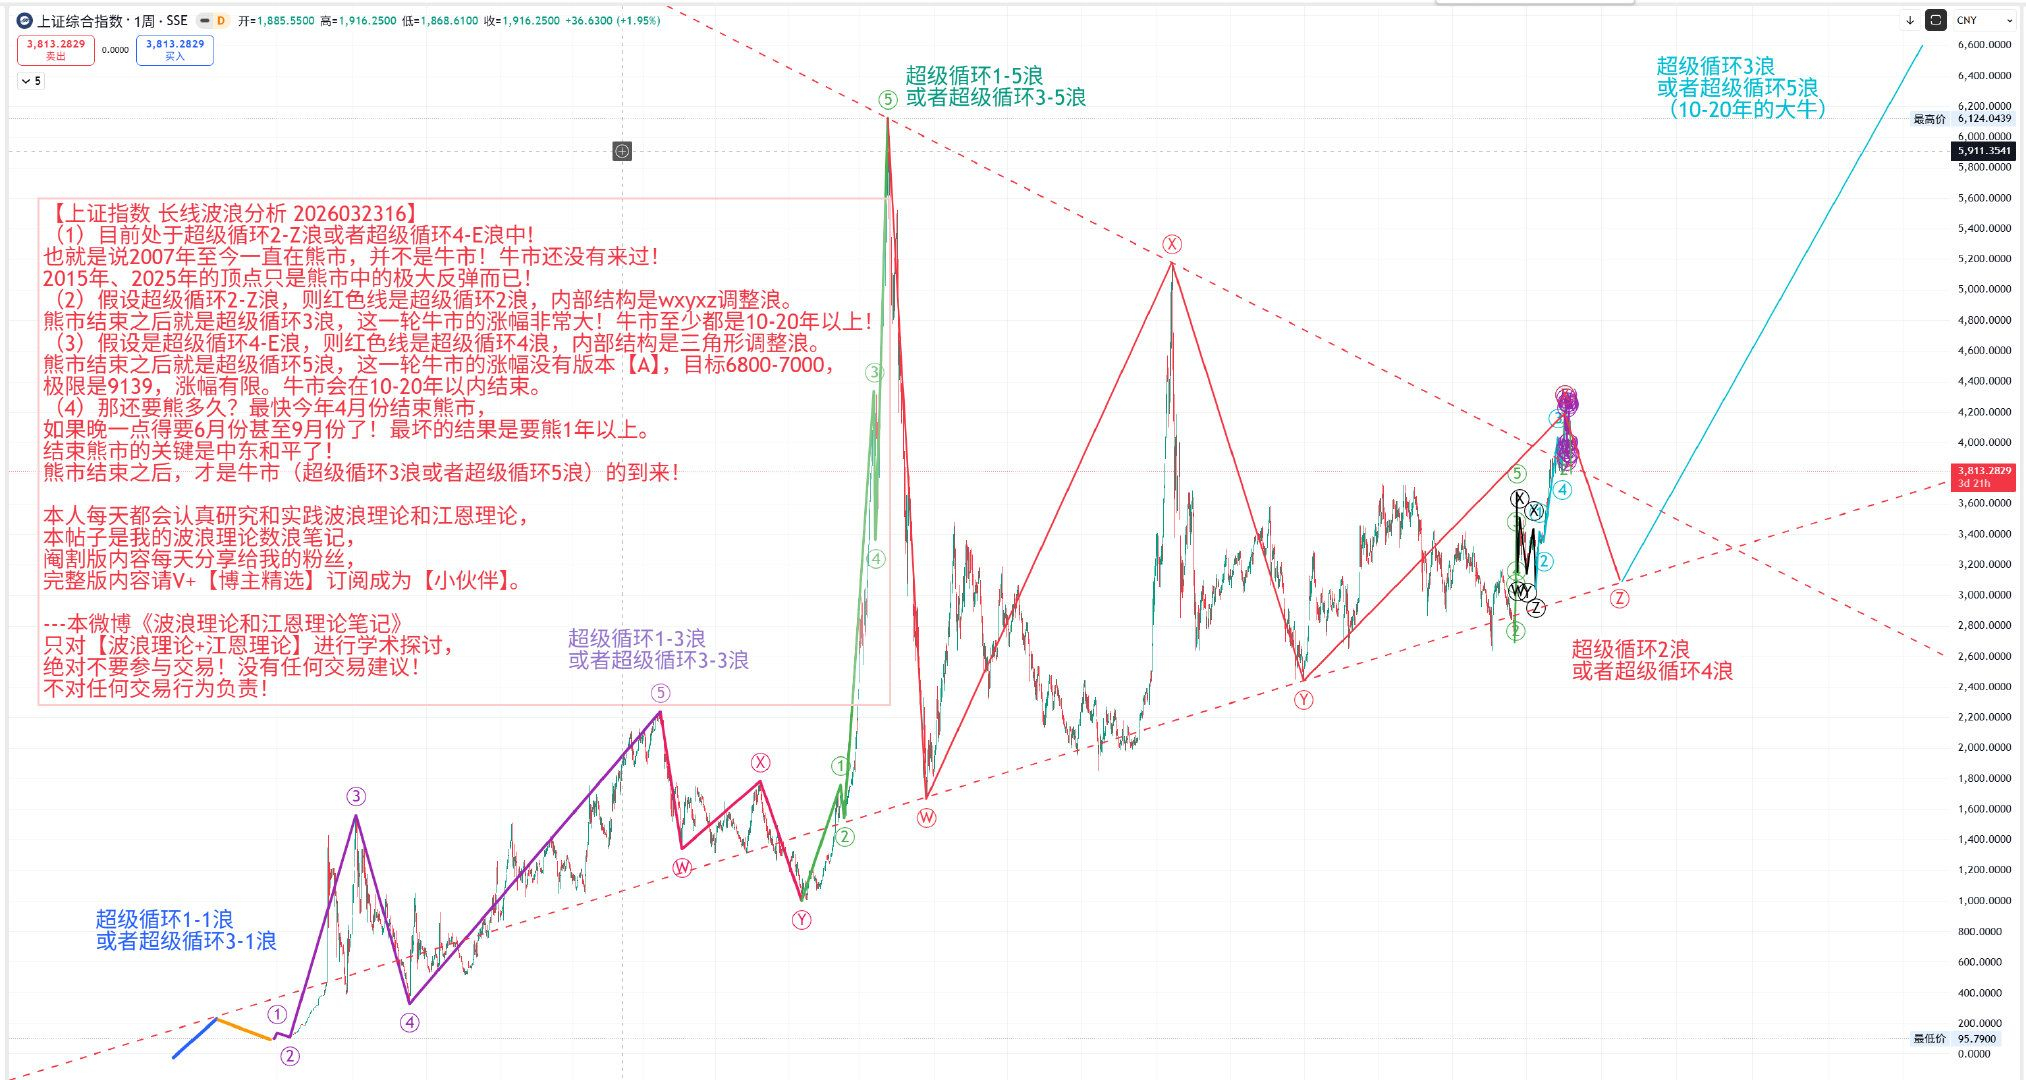
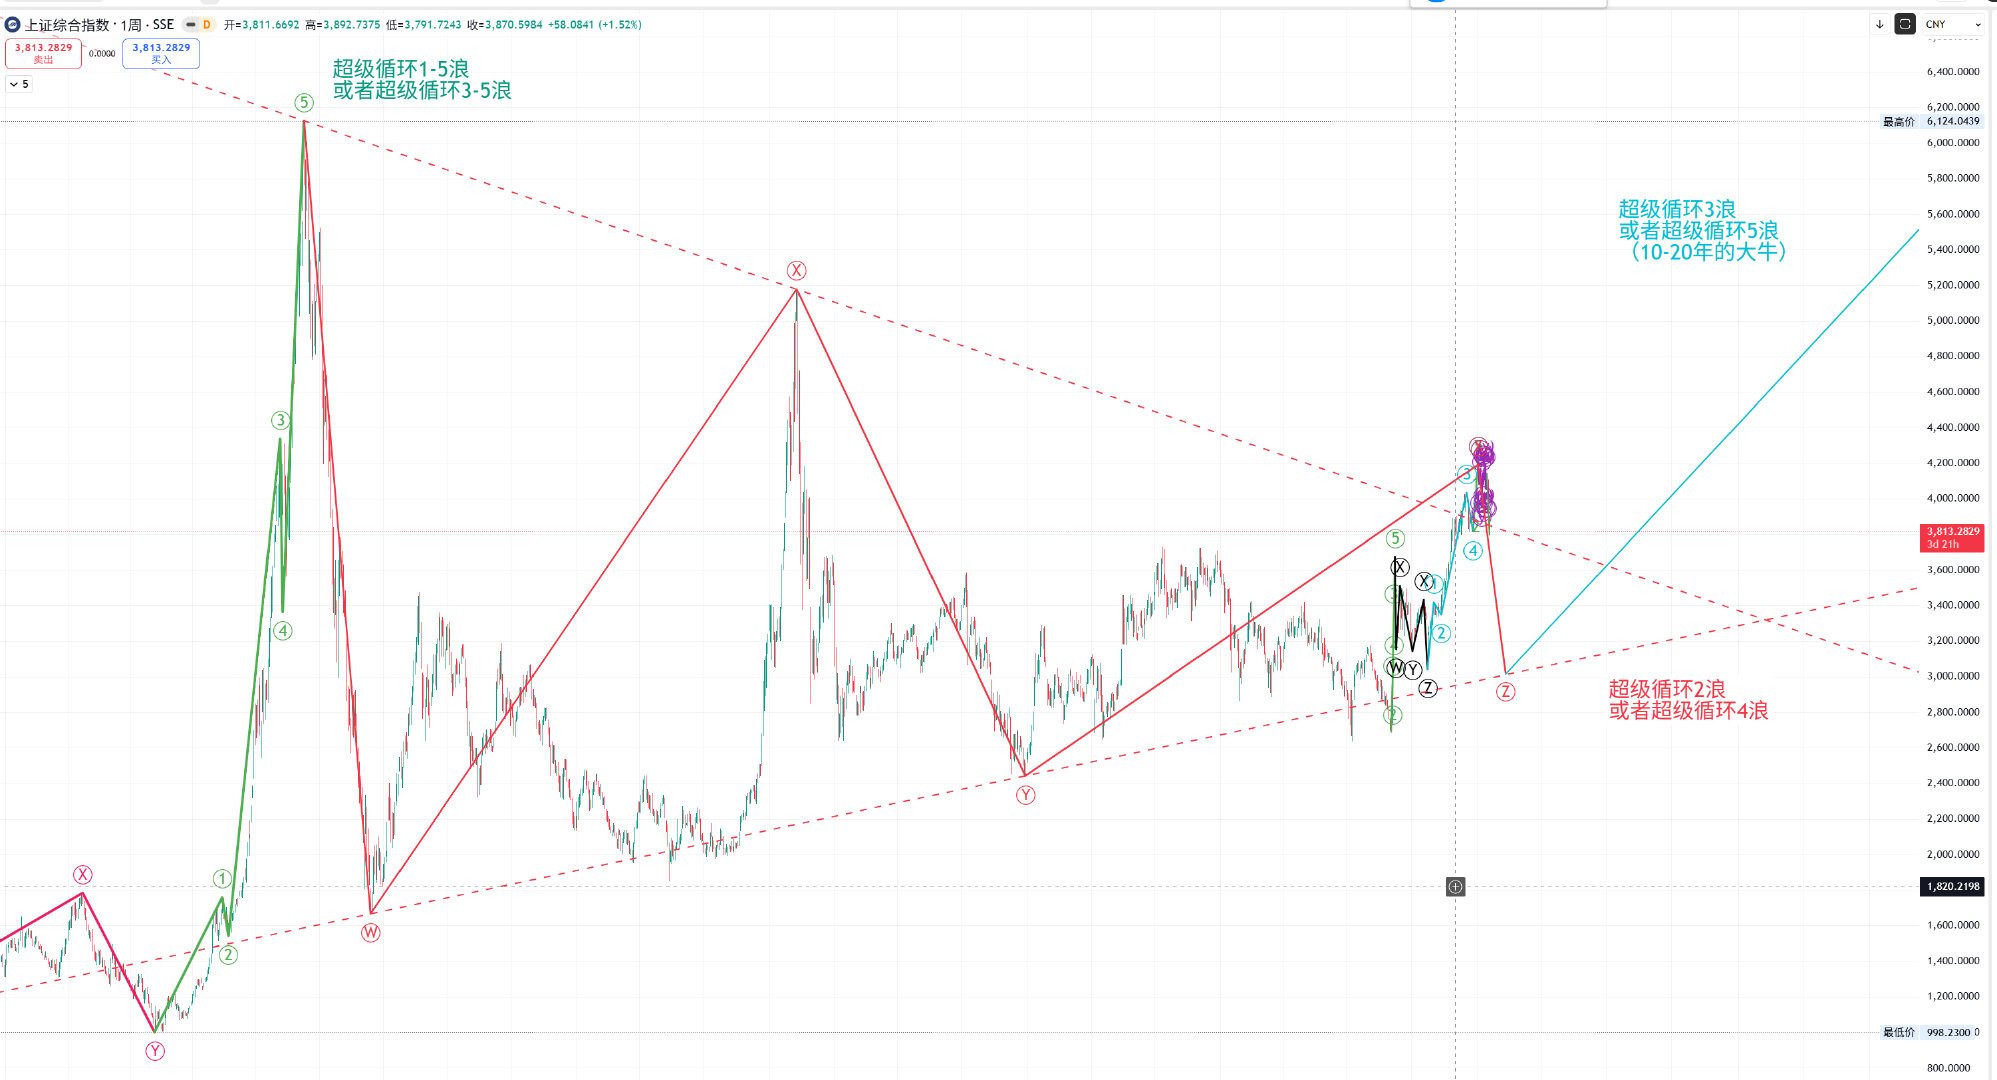
From the perspective of wave theory, the wave that started in September 2024 for the A-share Shanghai Composite Index is actually not a bull market, but a significant rise within a bear market. The real bull market starts from this golden pit! This golden pit is the beginning of a 10-year long bull market! Currently, we are in the super cycle 2-Z wave or super cycle 4-E wave! Detailed analysis will follow in subsequent chapters!
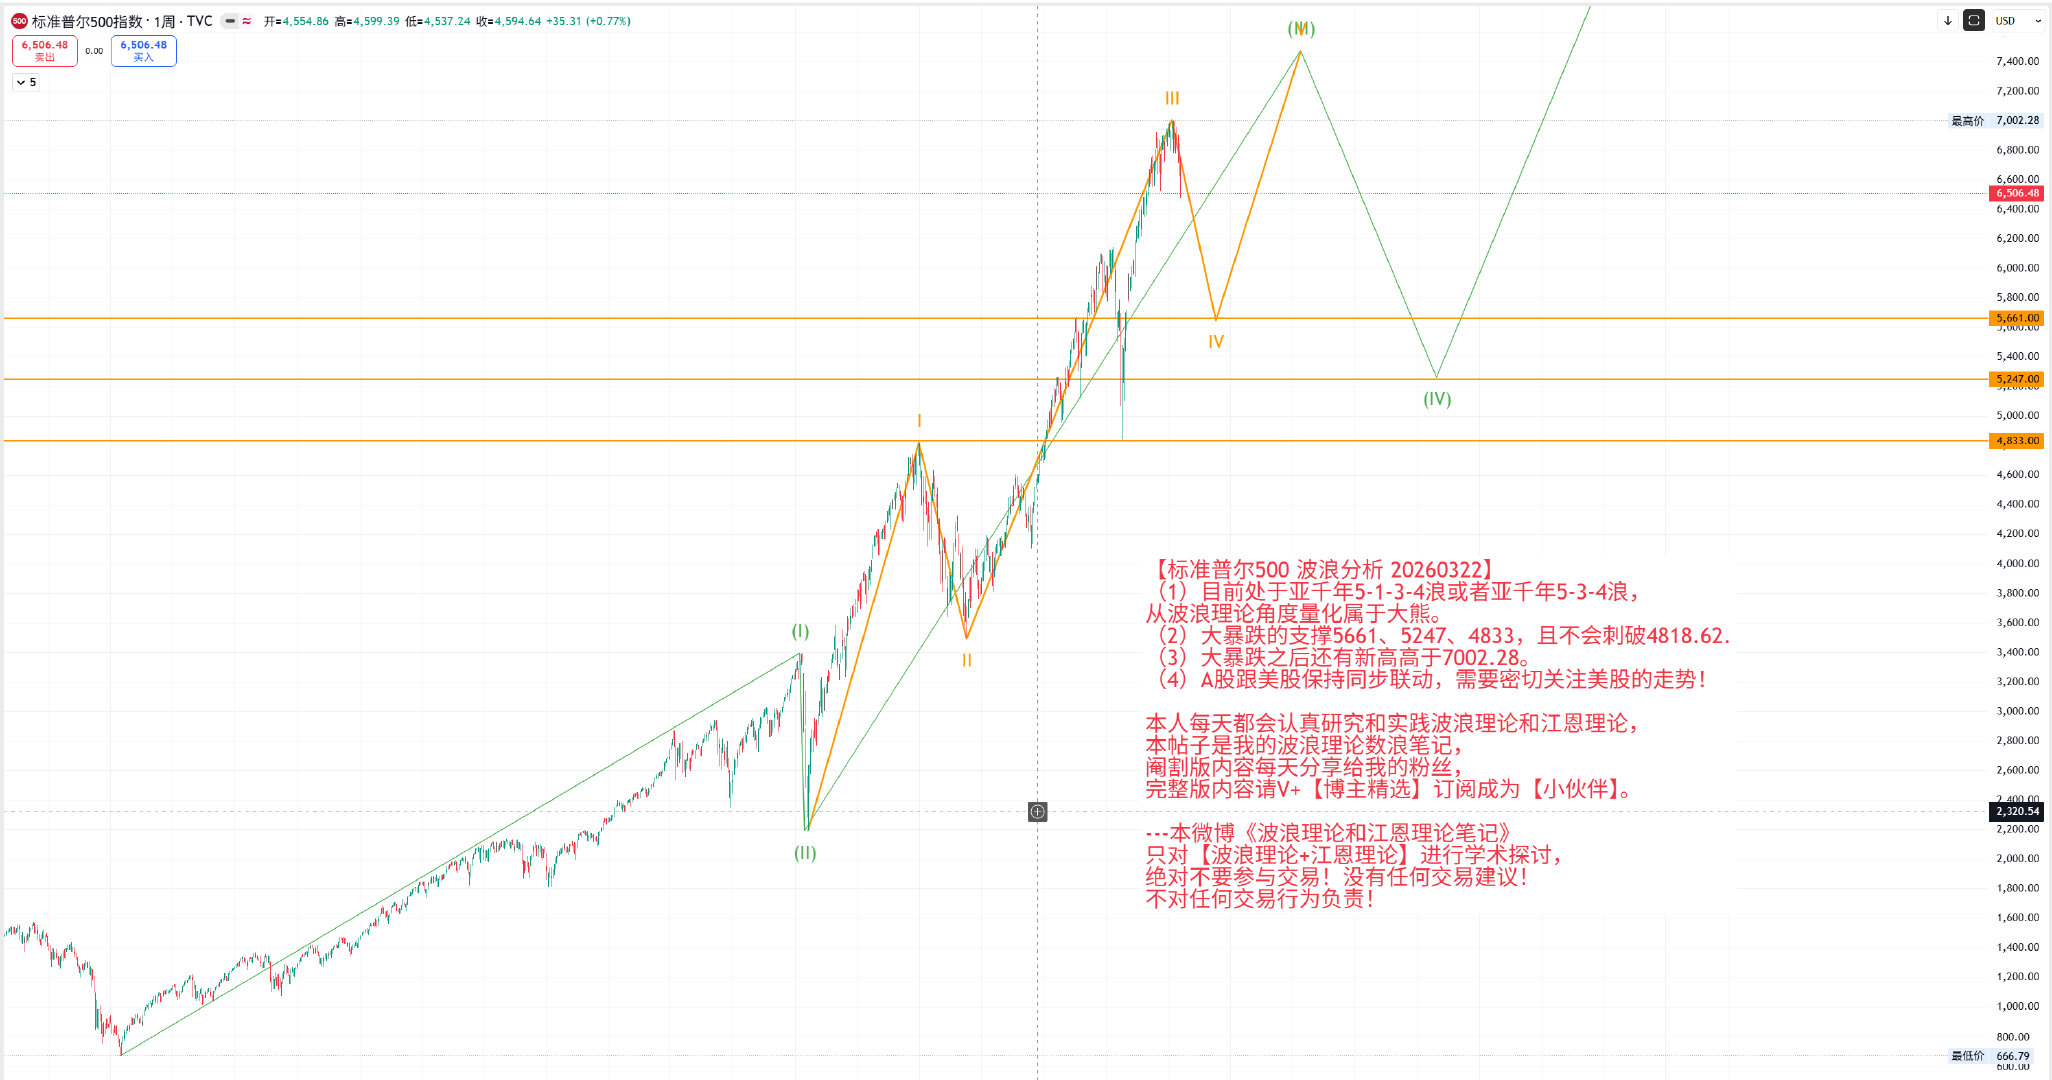
(4) On March 14, I pointed out that the [US stock market] entered a bear market and that the 5 waves were completed!

On March 16, I mentioned in the article ([Learning Notes] 14 - Global assets have entered a bear market! How to quantify the bear market using wave theory?) that global assets have entered a bear market!
On March 22, I pointed out that the [US stock market] is currently in the sub-millennium 5-1-3-4 wave or the sub-millennium 5-3-4 wave, which from the perspective of wave theory is quantified as a large bear market. The A-share market is synchronized with the [US stock market] and needs to closely monitor the trends of the [US stock market]! Only when the [US stock market] ends the bear market will the A-share market end the bear market!
Two, no one supports your aspirations; the bear market sends you to the western heaven! Supply chain shocks, a global asset bear market is about to decline significantly!
Do you see how I repeatedly remind everyone about the bear market?
Three, a larger golden pit is still ahead! The bear market is here, what should we do?


Everyone should check out the recent few high-quality video suggestions!
Four, Bitcoin BTC trend analysis
1. Wave theory notes
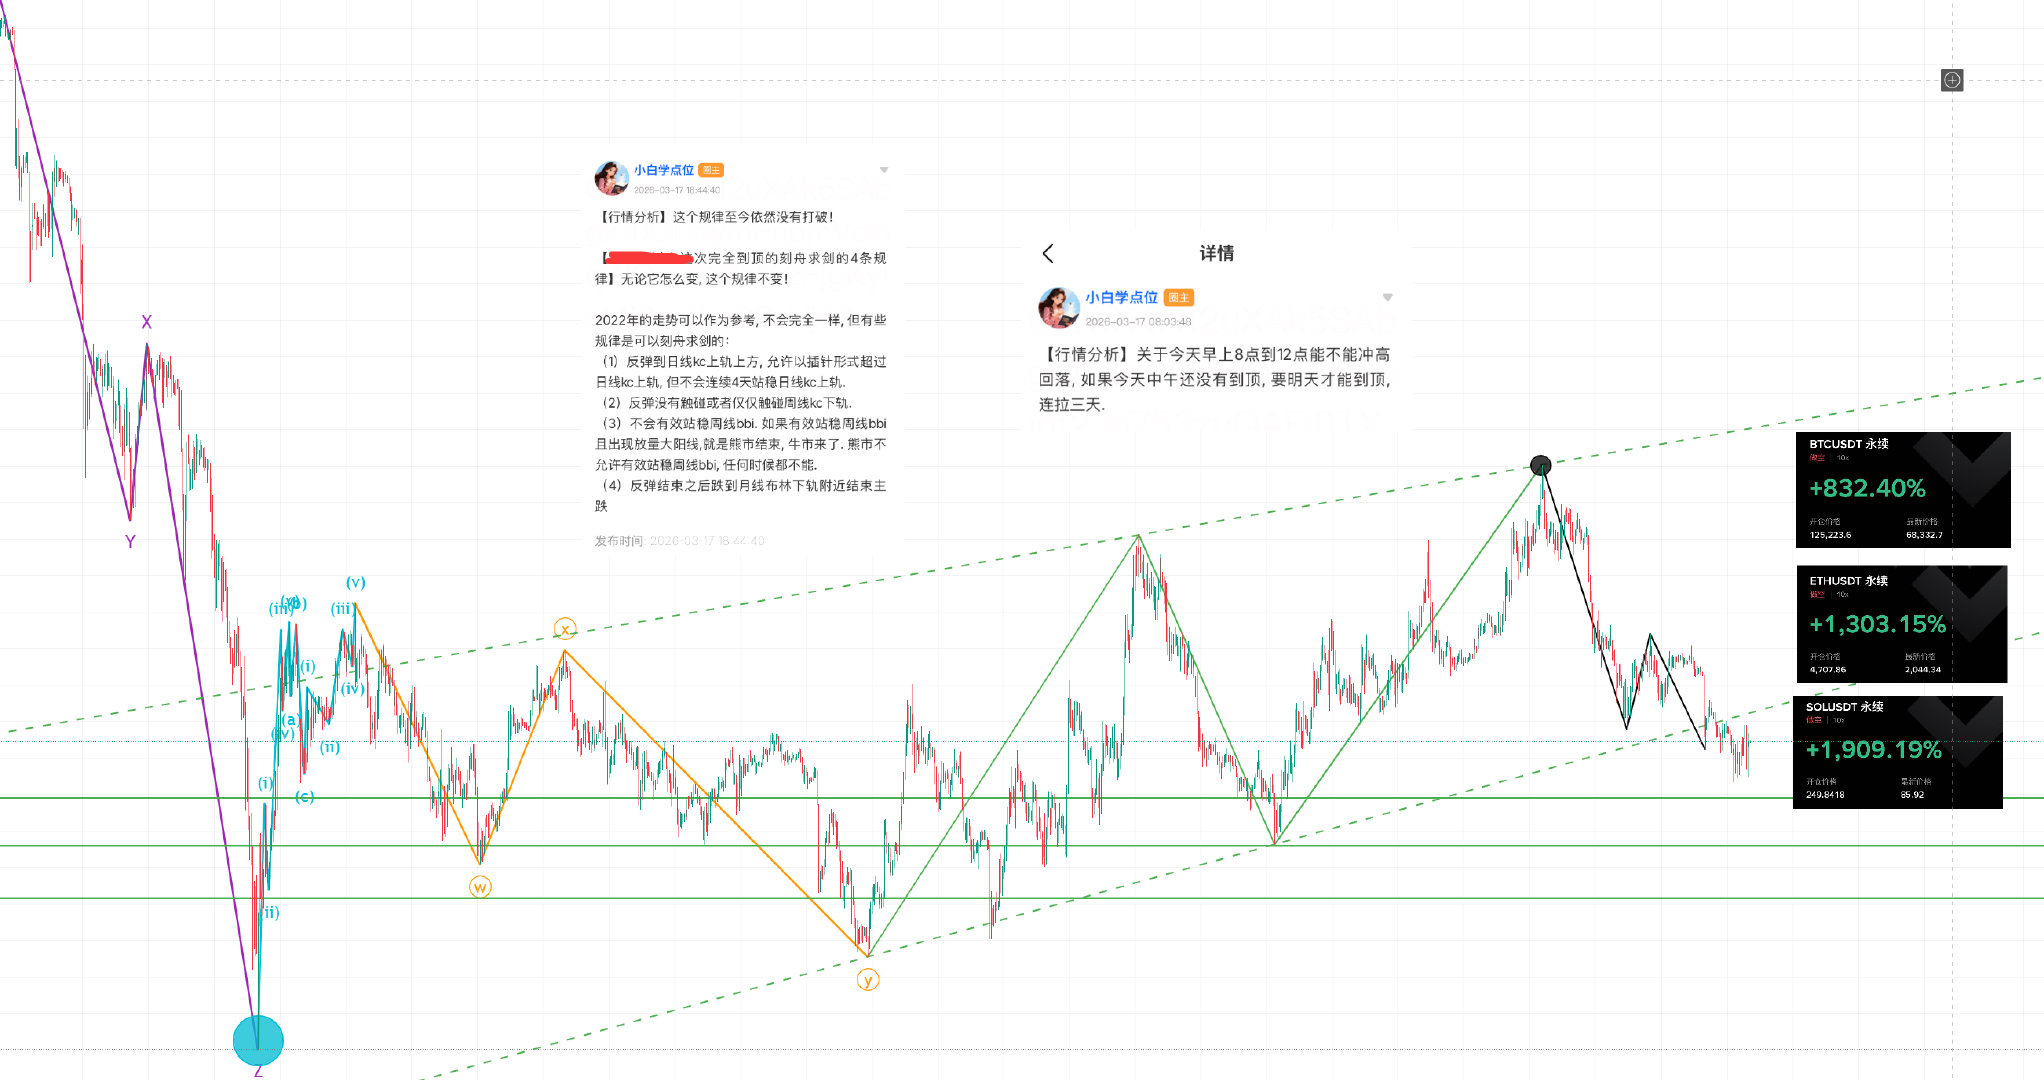
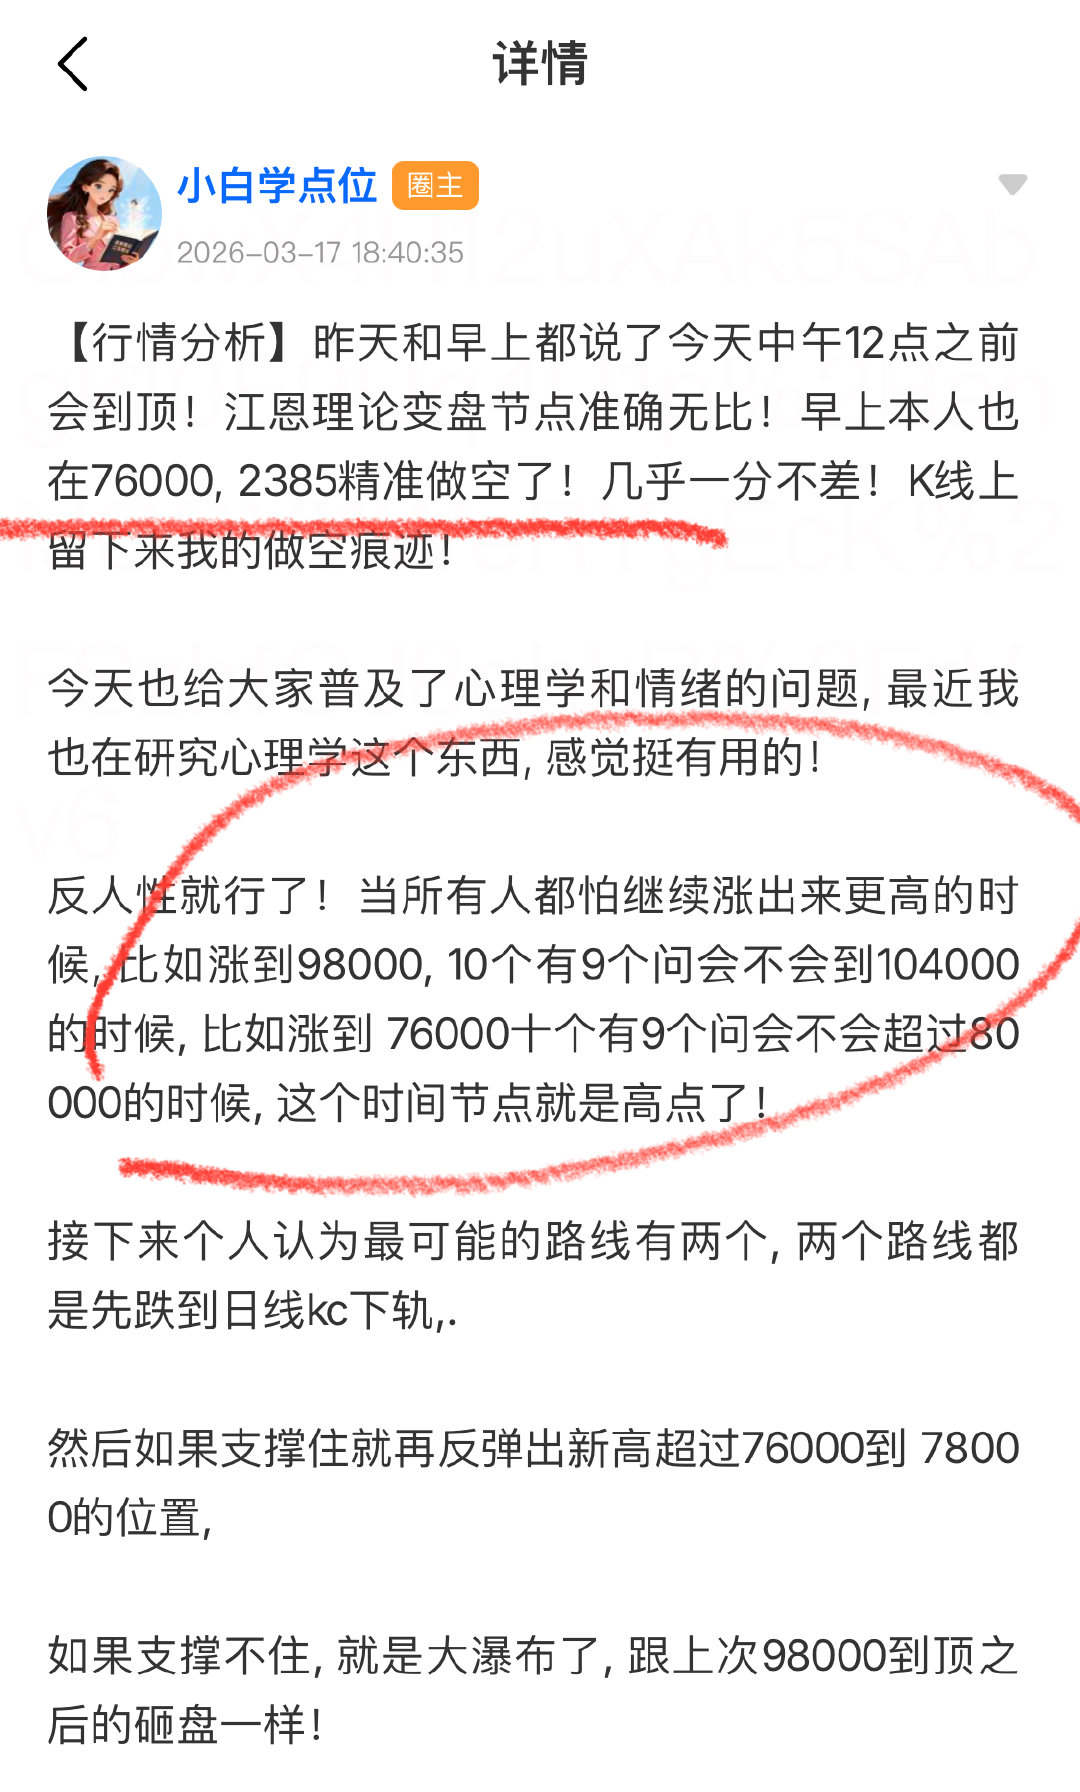
The possibility of completely reaching the peak here is very high! On March 17, I spoke to everyone about some psychological and emotional issues regarding adjustments:

On March 17, I once again confirmed the stage peak and proposed two of the most likely routes:
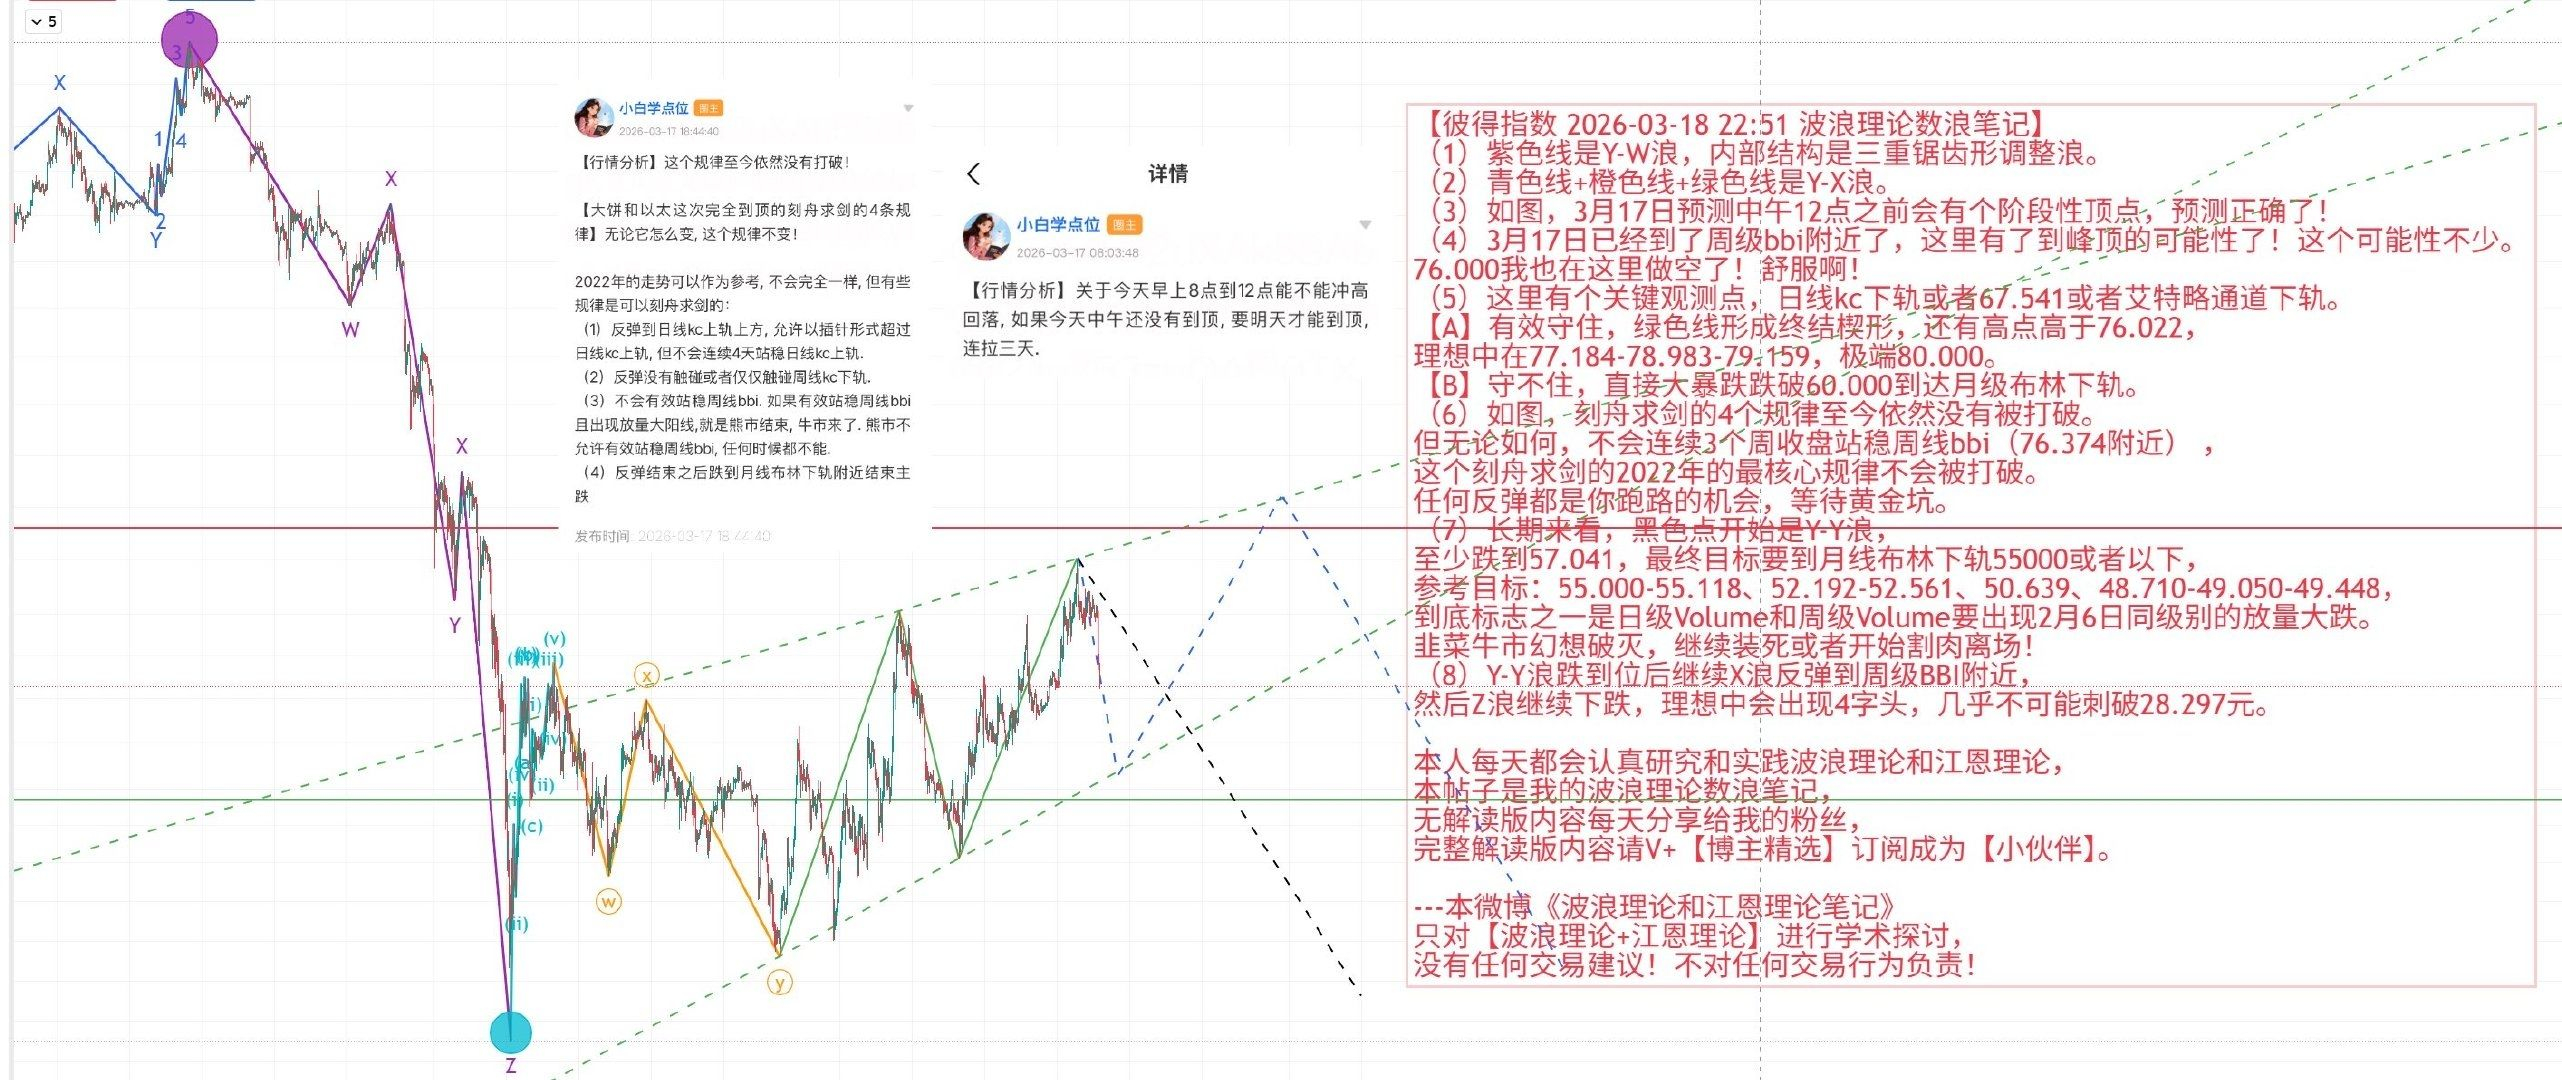
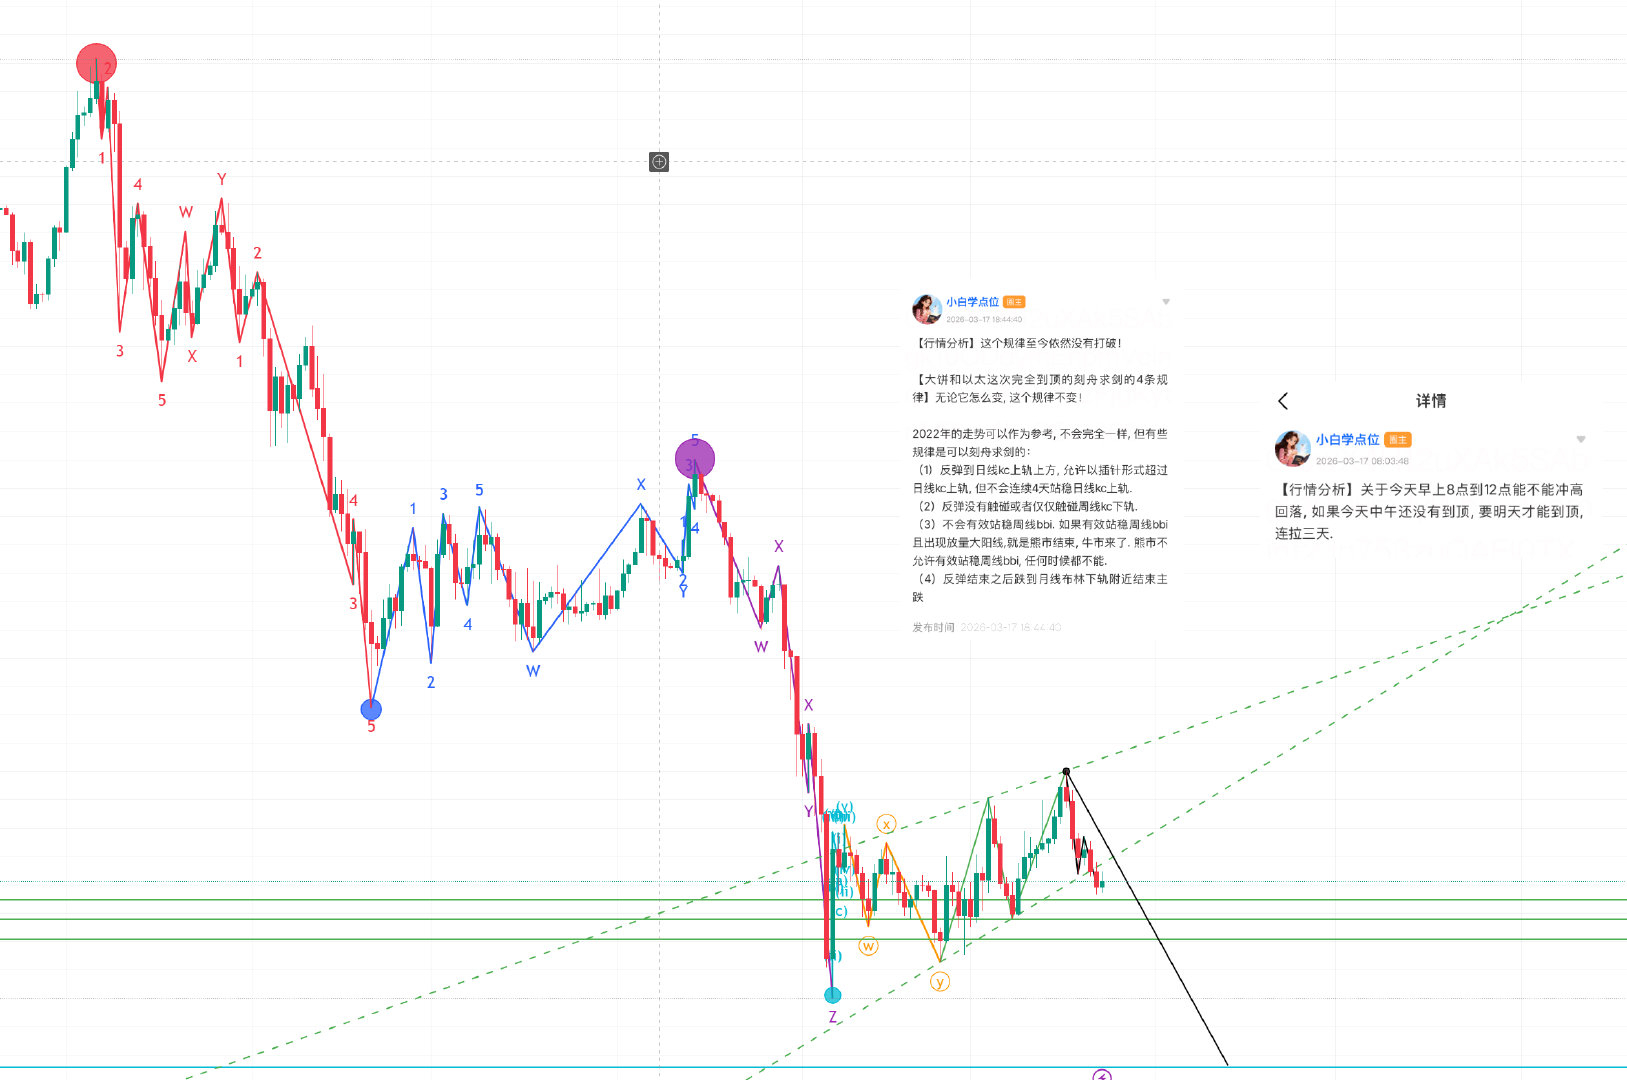
The wave analysis chart proposed last week, as shown in the following four diagrams, has all been successfully verified!
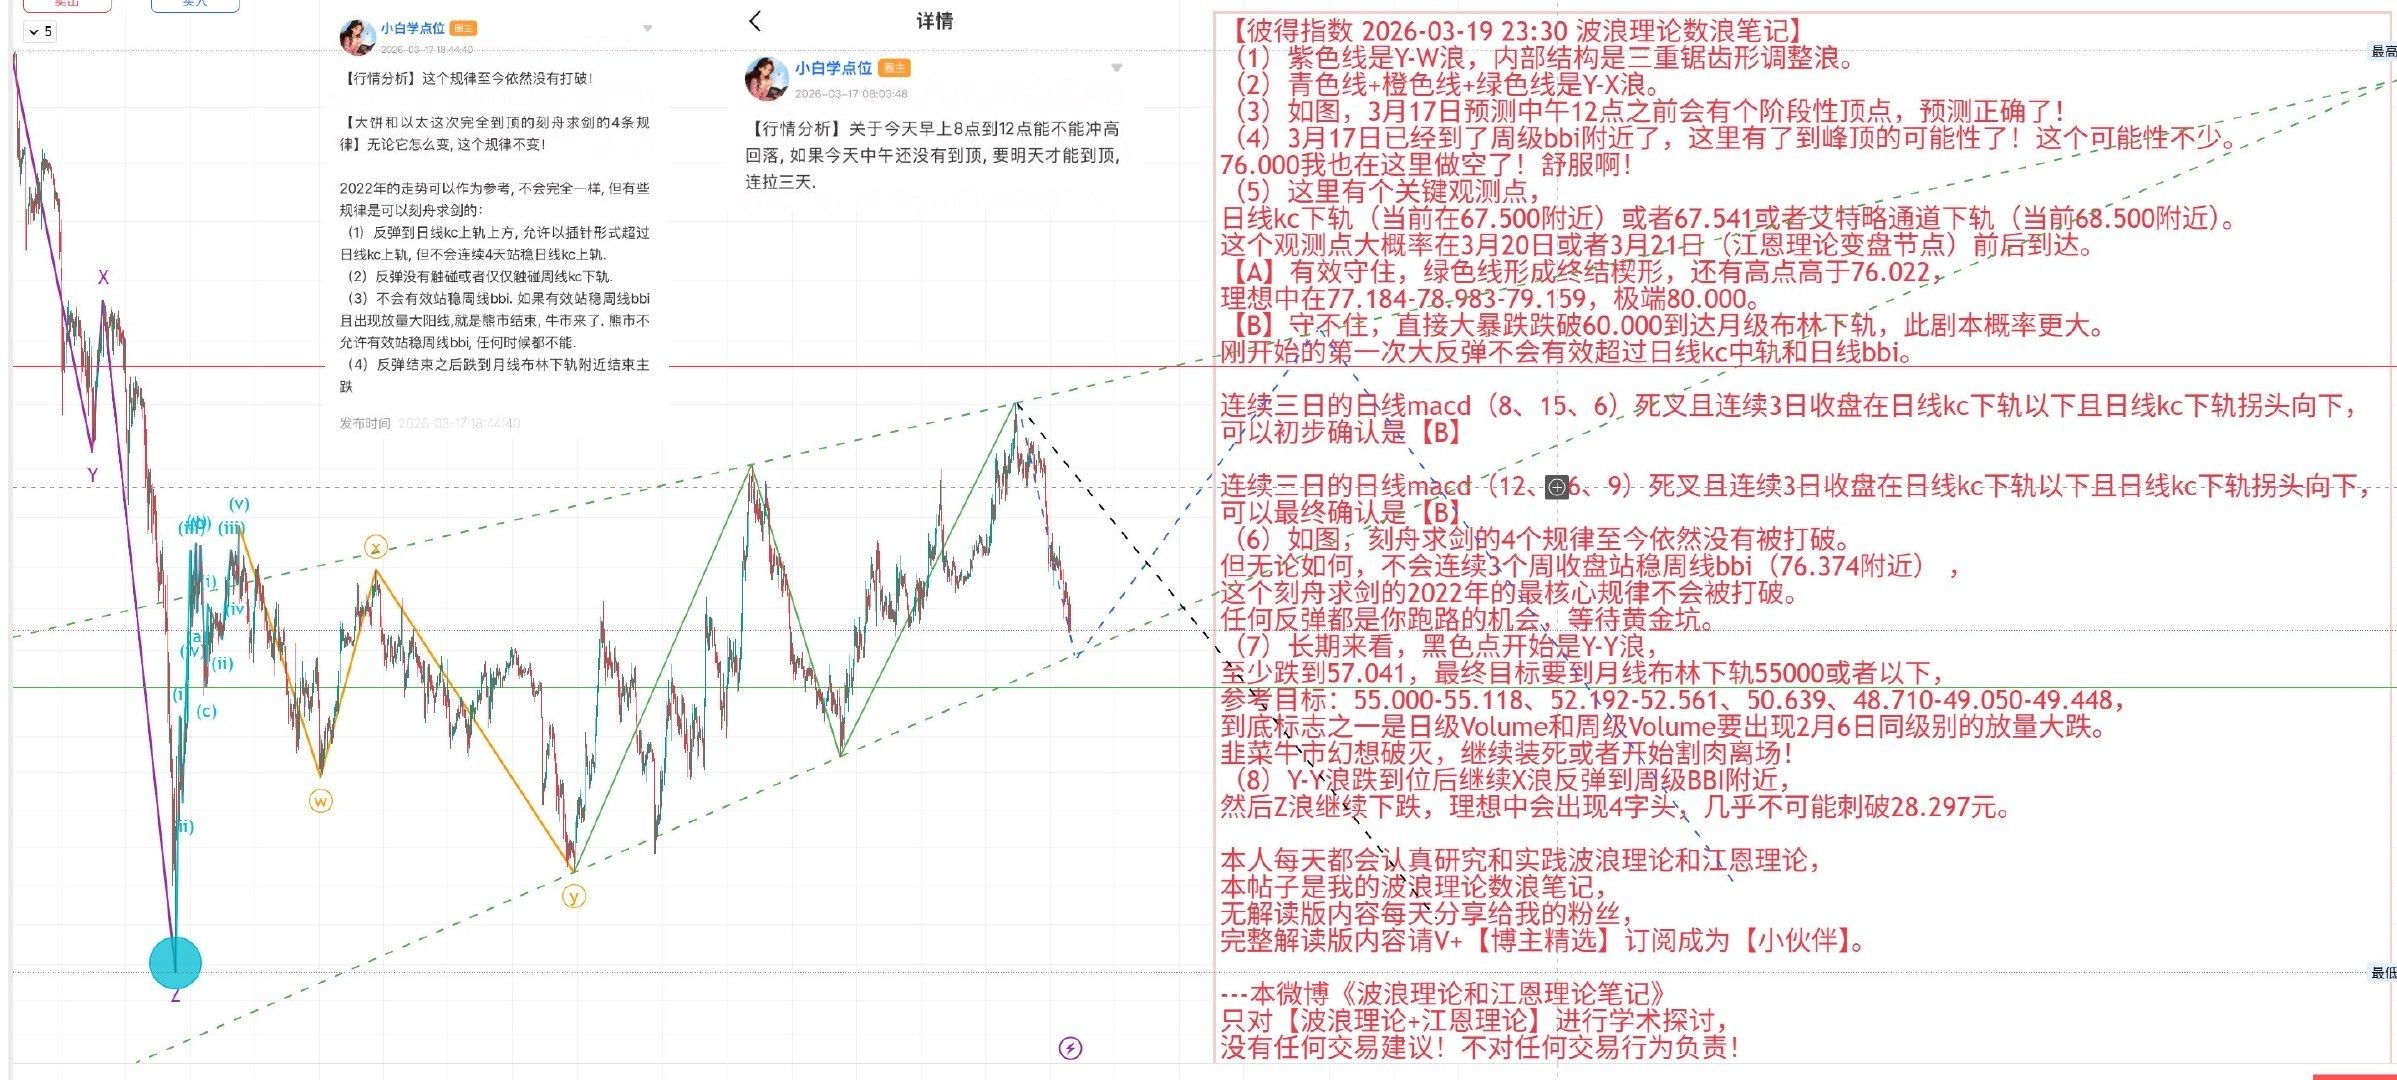
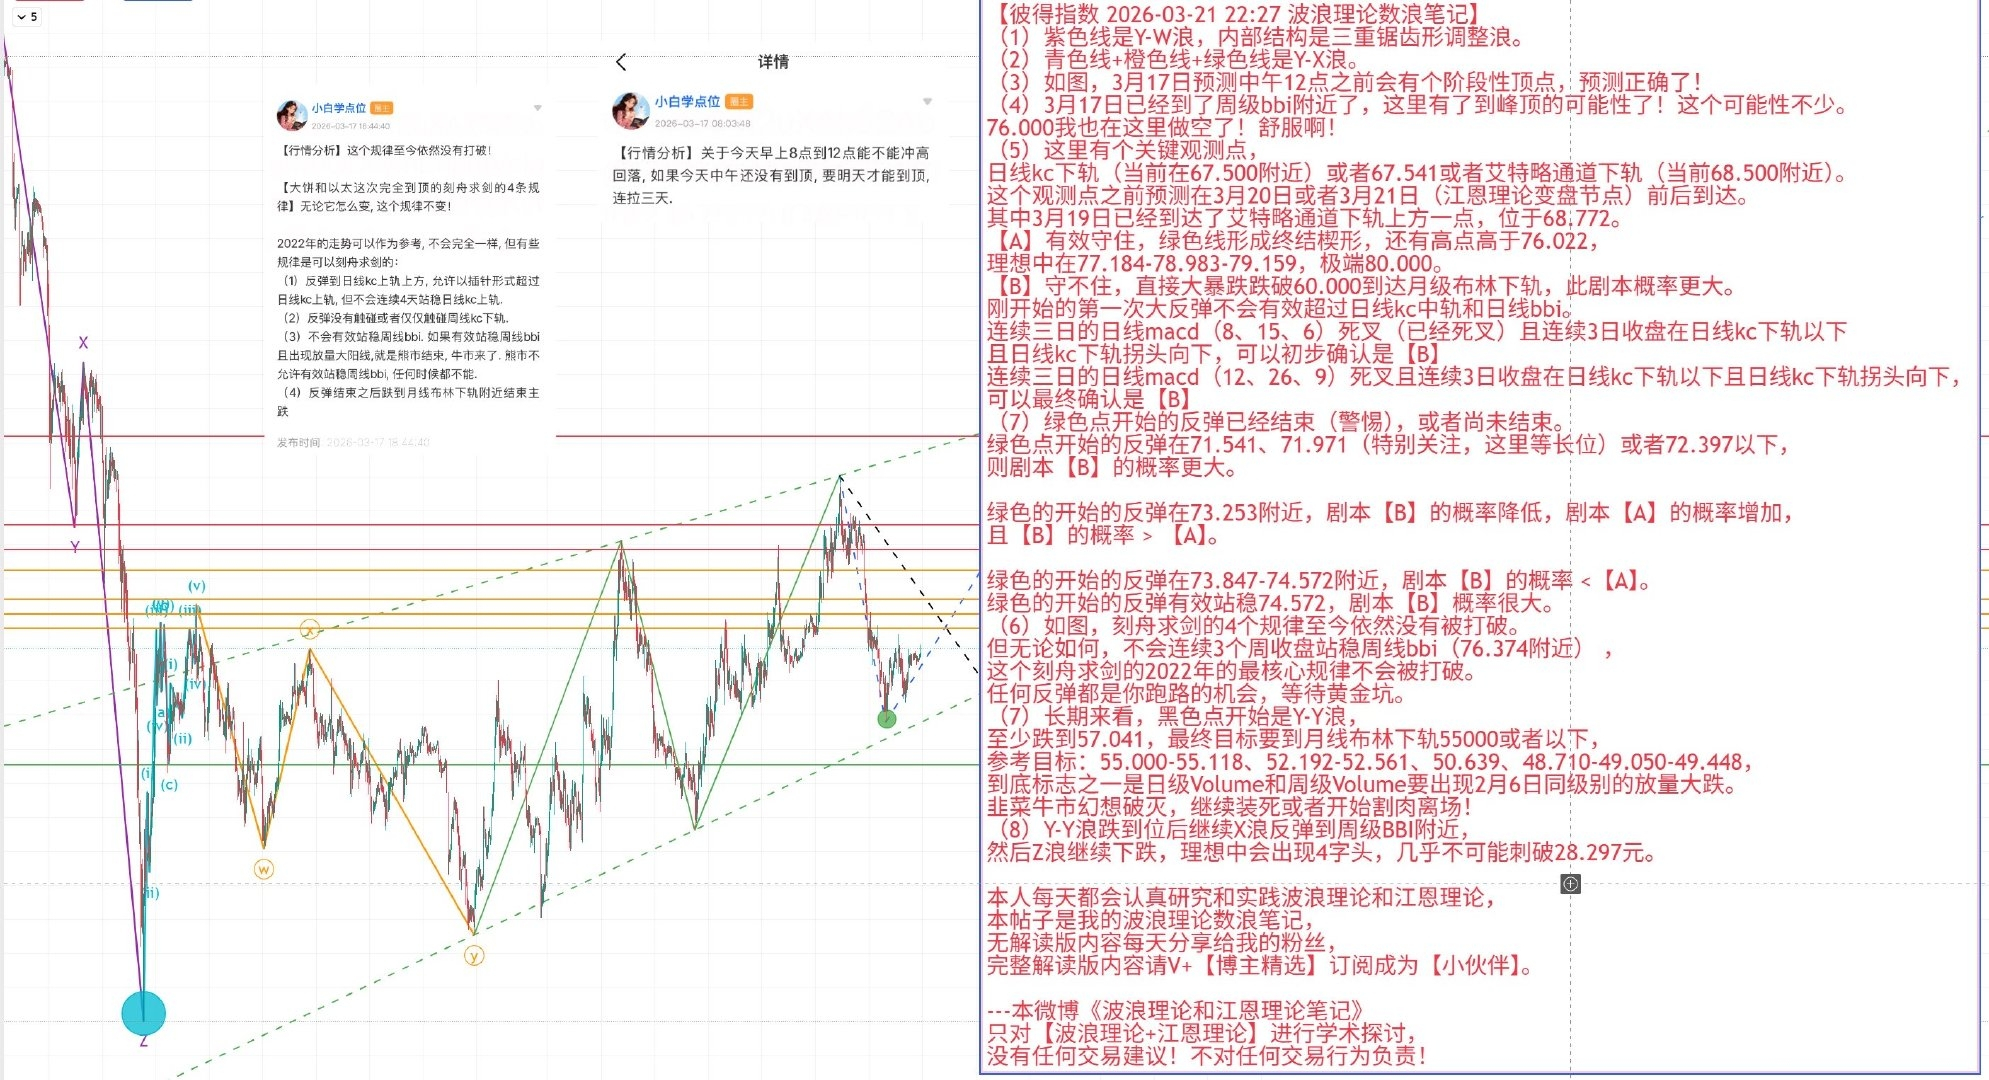
Are you seeing something very similar here?
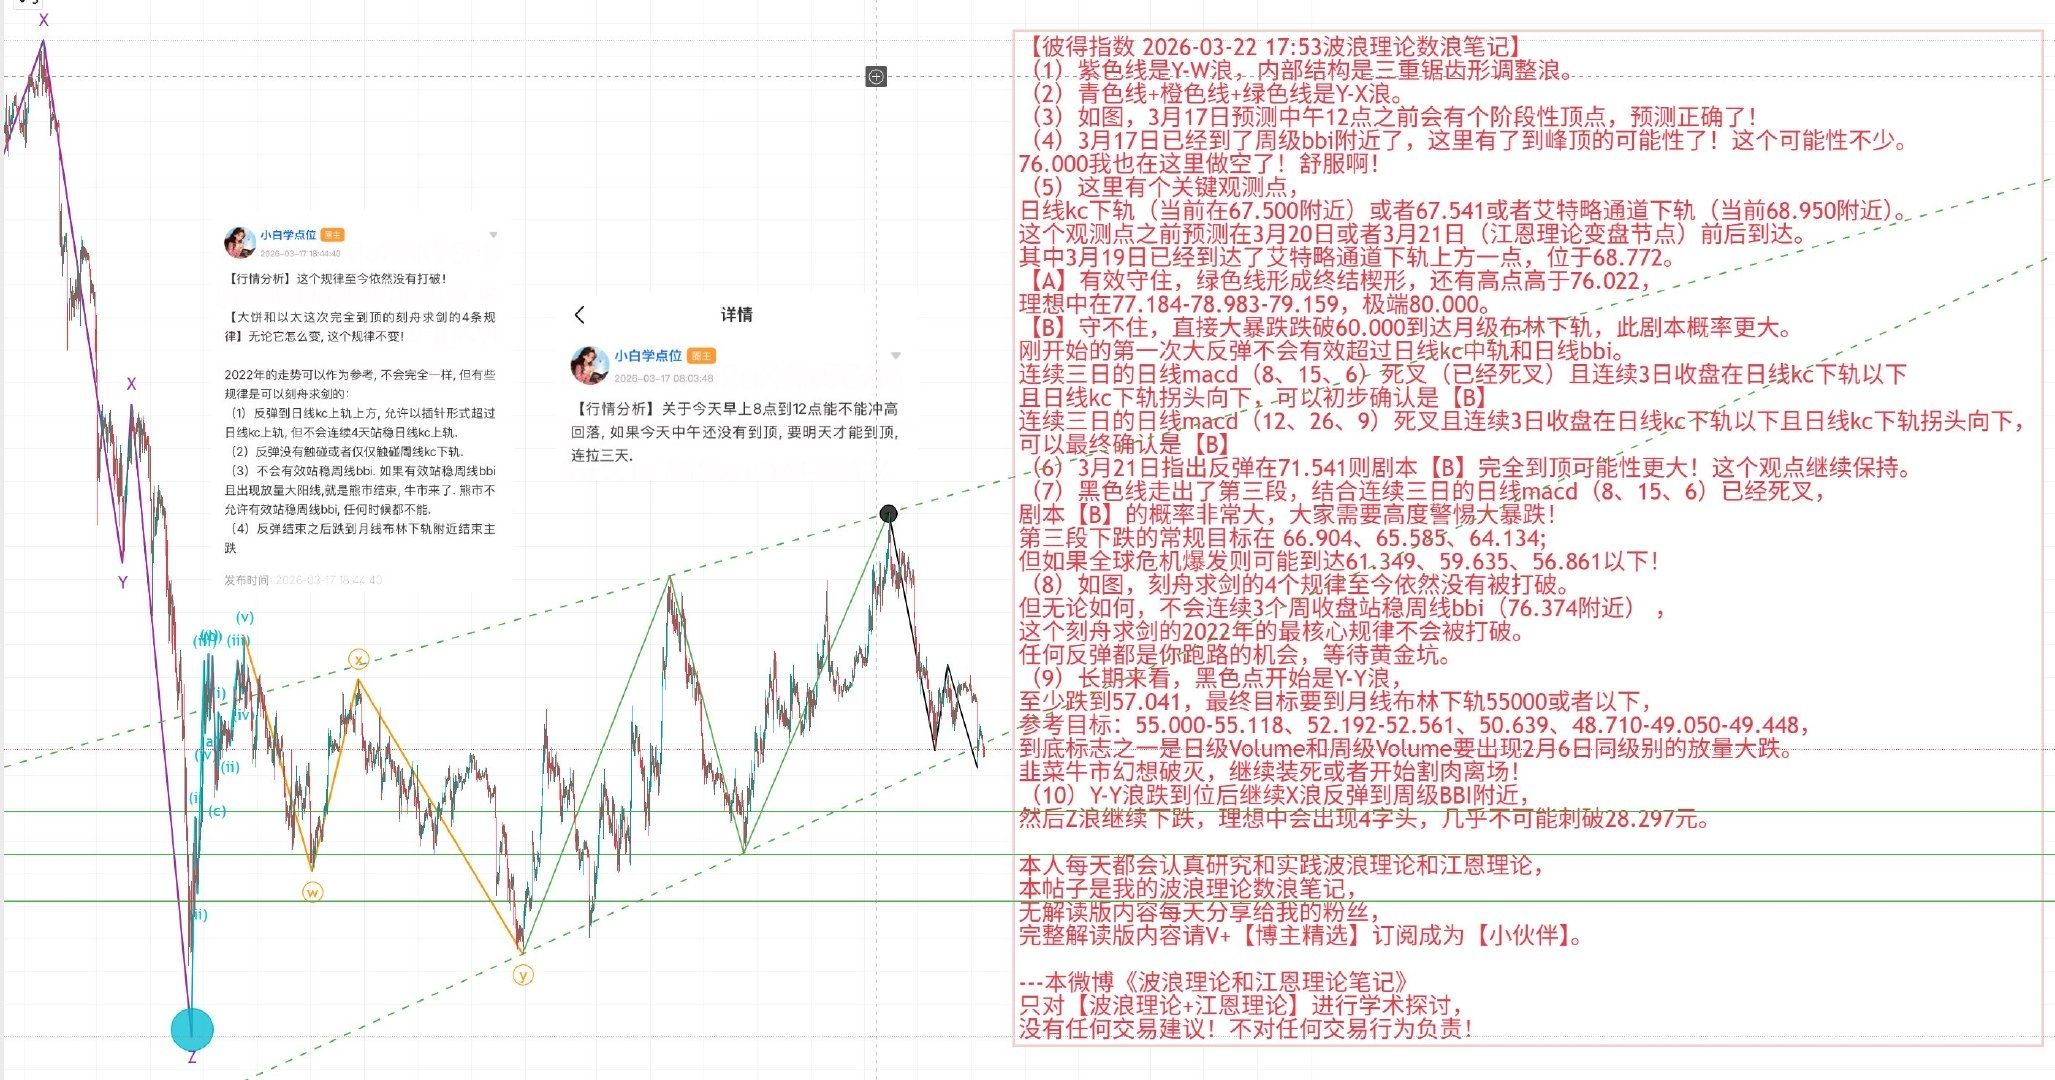
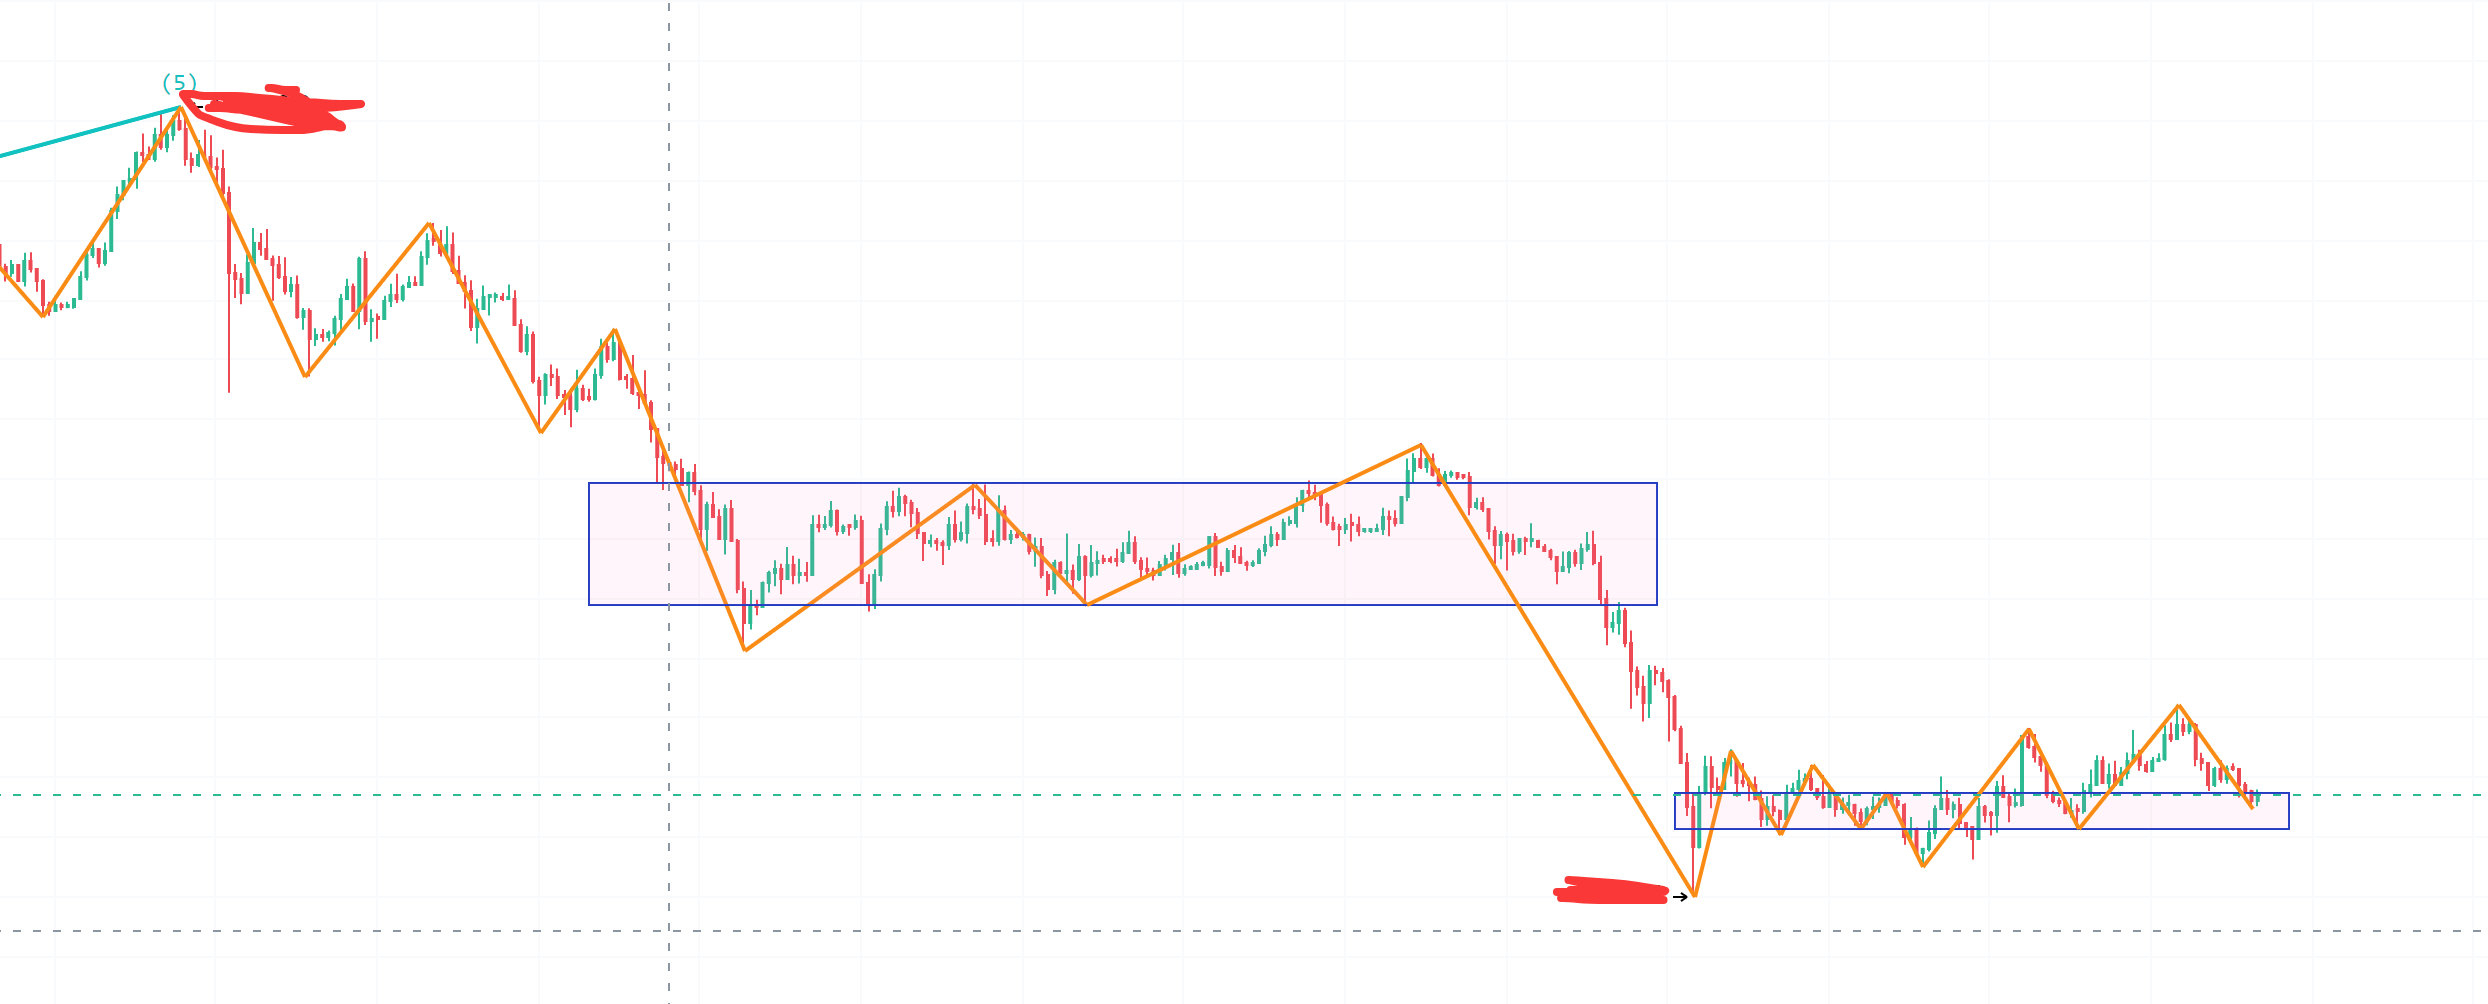
The latest wave analysis chart is as follows, please study it carefully (with modifications):
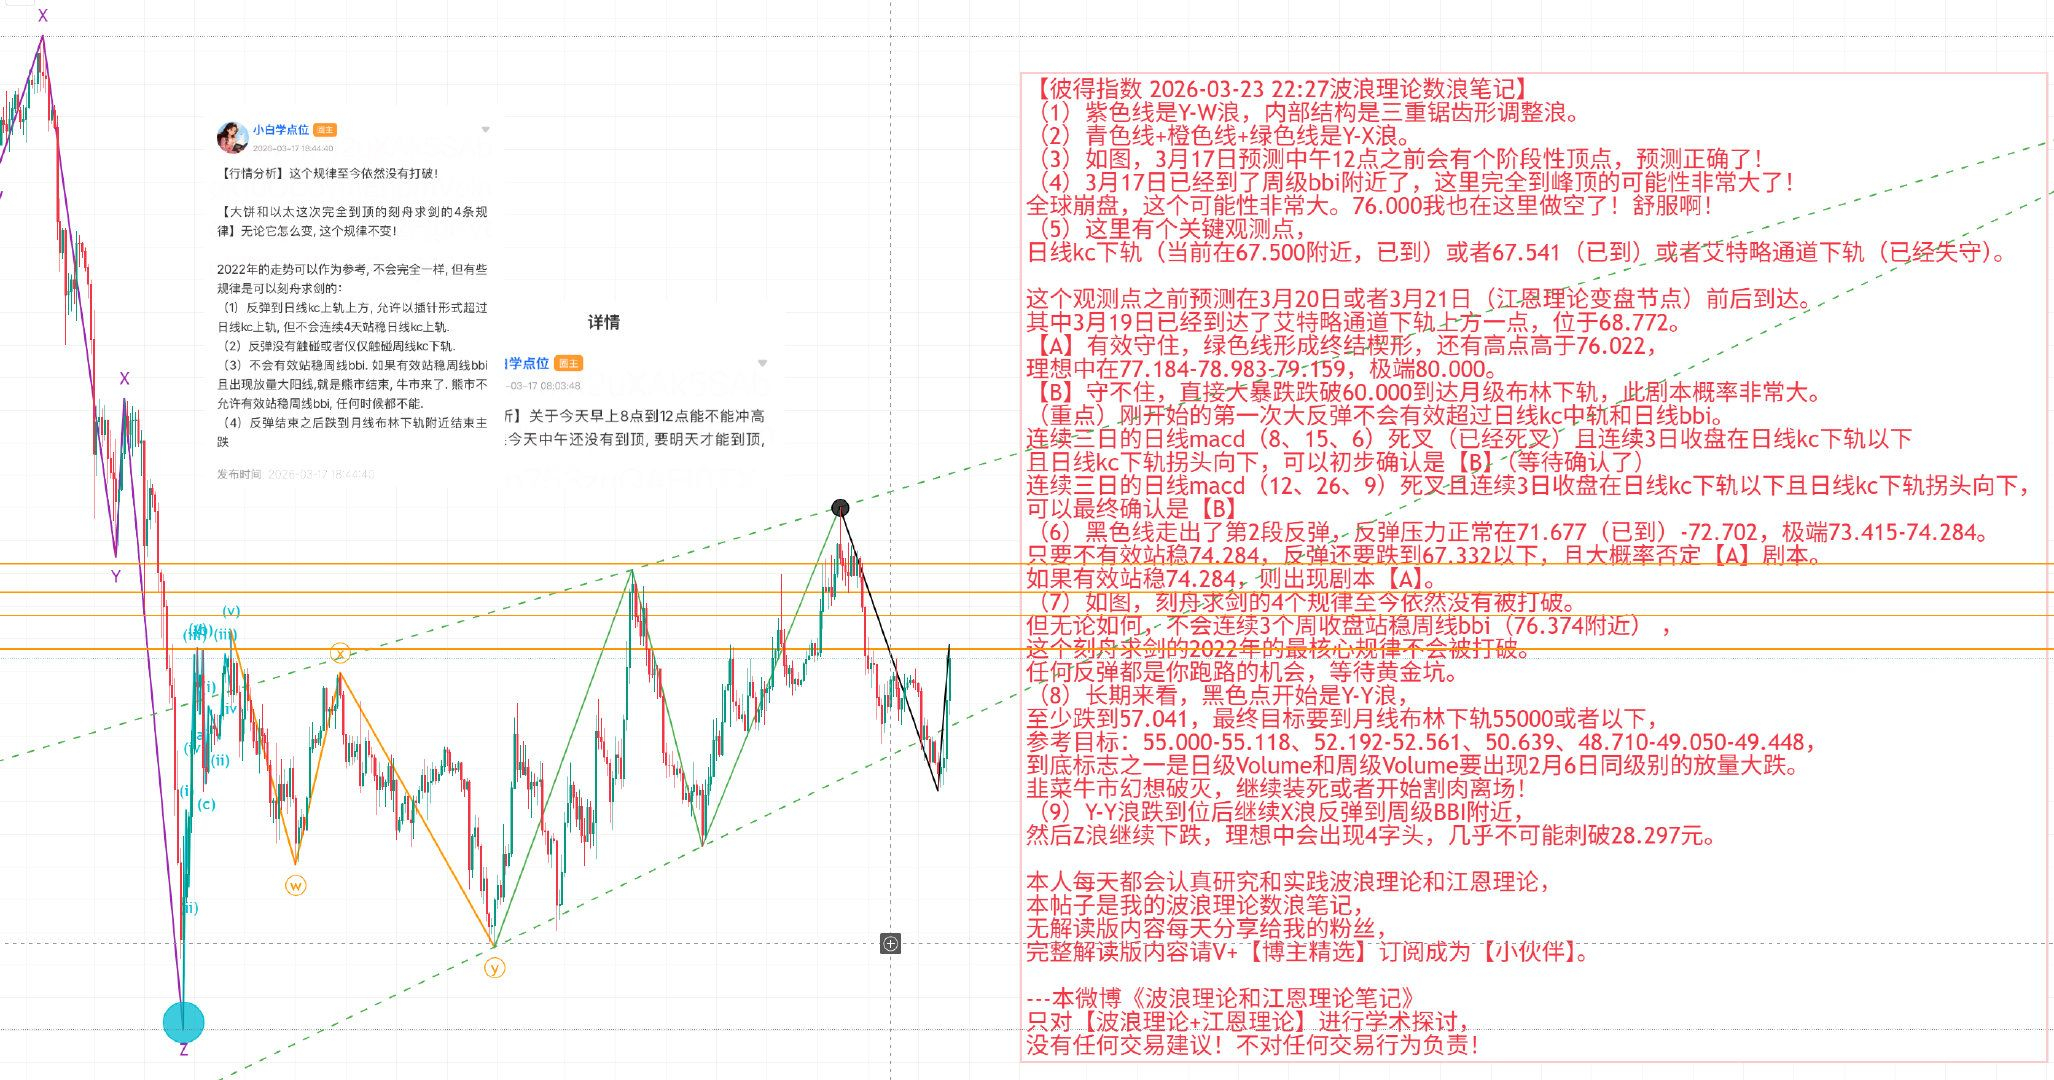
The overall wave analysis chart is as follows:
2. Gann theory notes
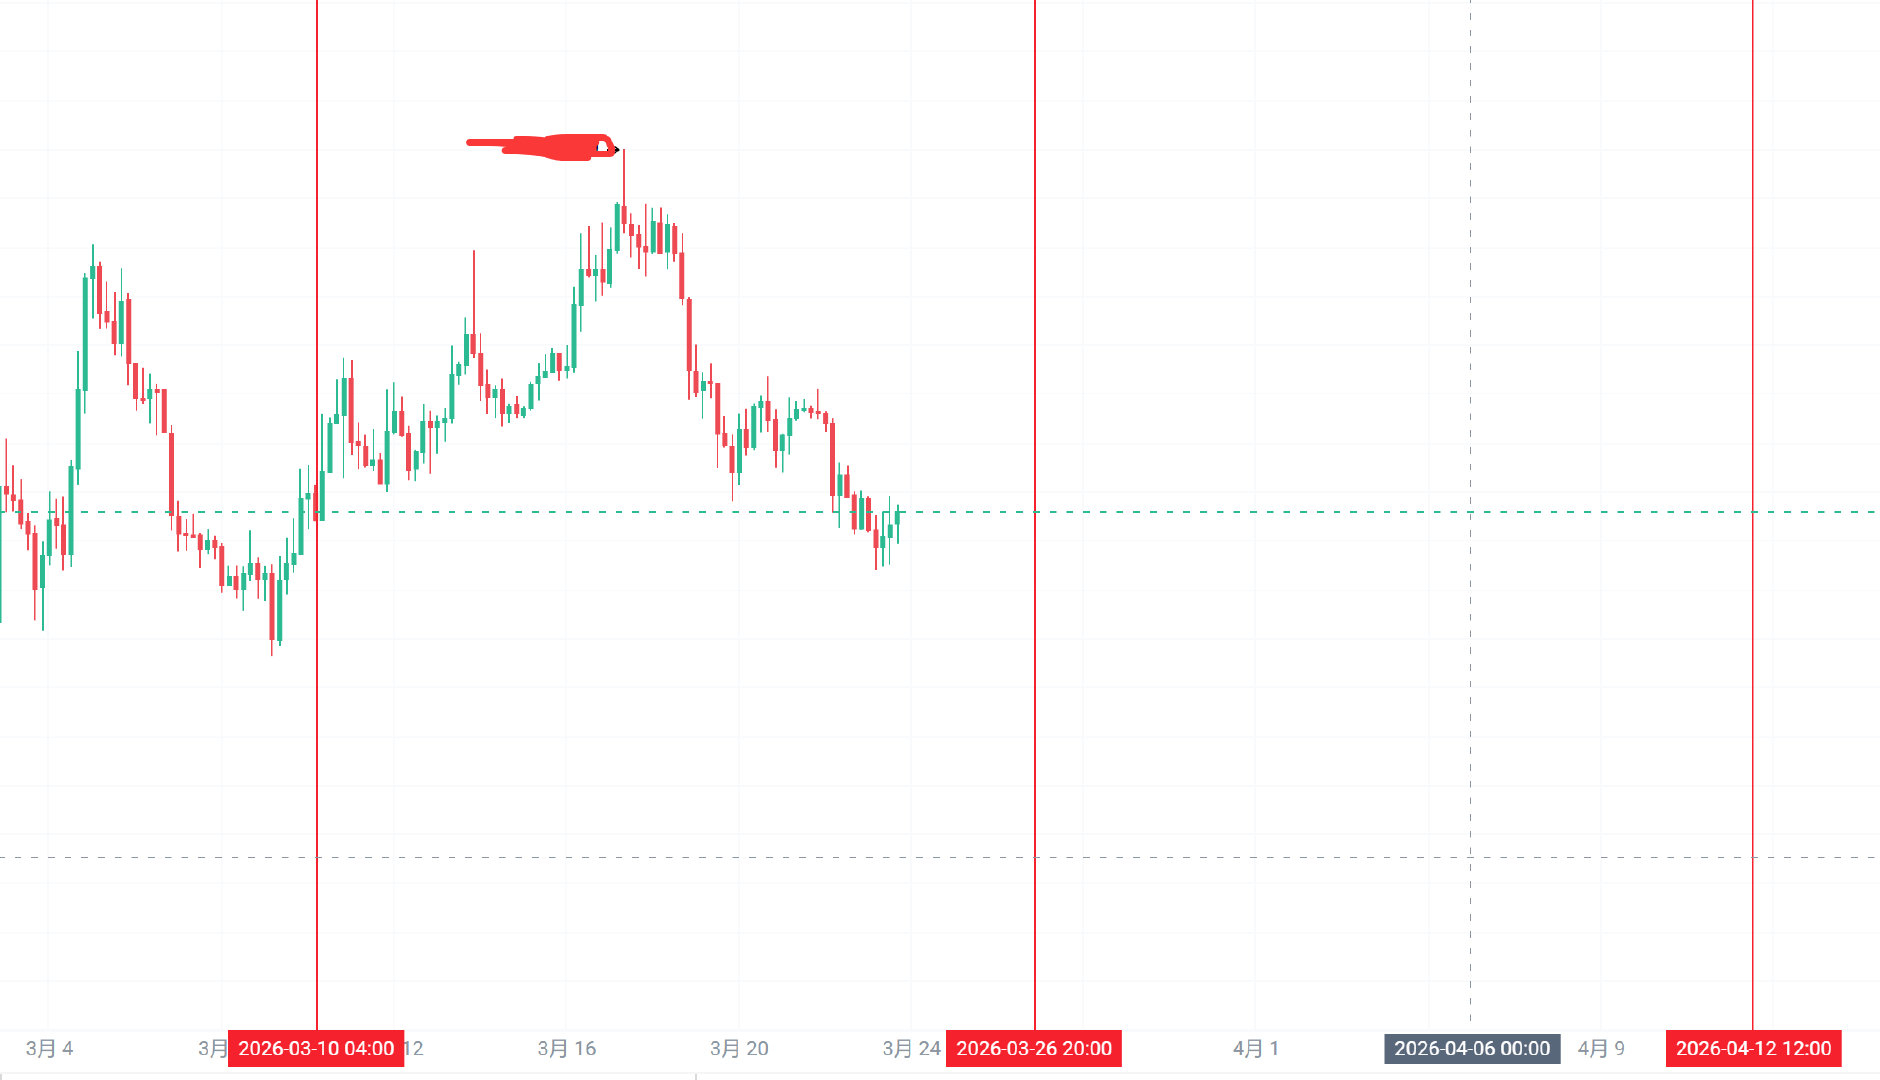
(1) Gann time series
We use the historical peak on October 6, 2025, as the starting point, and the low point on October 11 as the reference point to draw the latest [Gann time series].
Important turning points have been verified on January 19, 2026, and March 10, 2026! Those who say Gann theory is useless have no conscience!
The next important turning points are on March 26, 2026, and April 12, 2026.
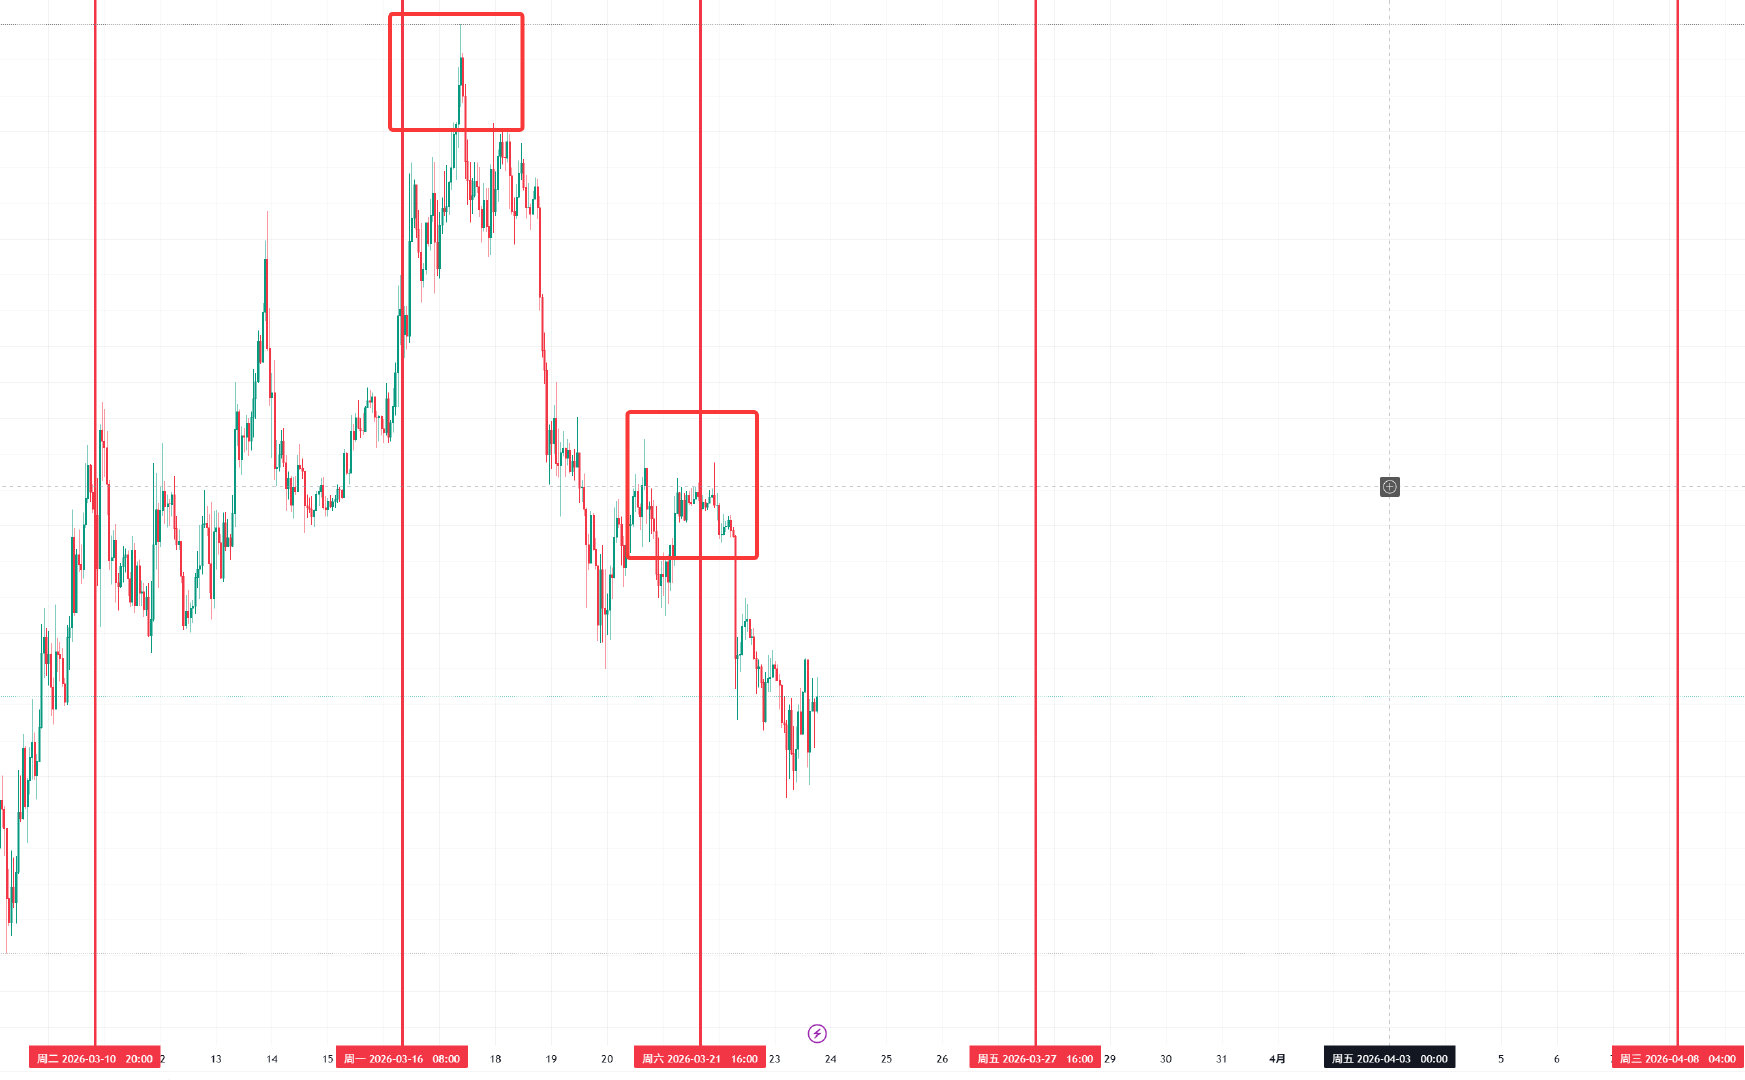
(2) Gann box
We use the historical peak on October 7, 2025, as the starting point, and the lowest point on November 21, 2025, as the reference point to draw the latest [Gann box].
Important turning points have been verified on January 15, 2026, February 9, 2026, February 24, 2026, March 4, 2026, March 16, 2026, and March 21, 2026! Those who say Gann theory is useless have no conscience!
The next important turning points are on March 27, 2026, and April 8, 2026. Subsequently, we can further filter through Gann angle lines and wave theory, Wyckoff model, or wave theory to sift out some unimportant turning points and determine whether they are peaks or troughs.
(3) Gann angle lines
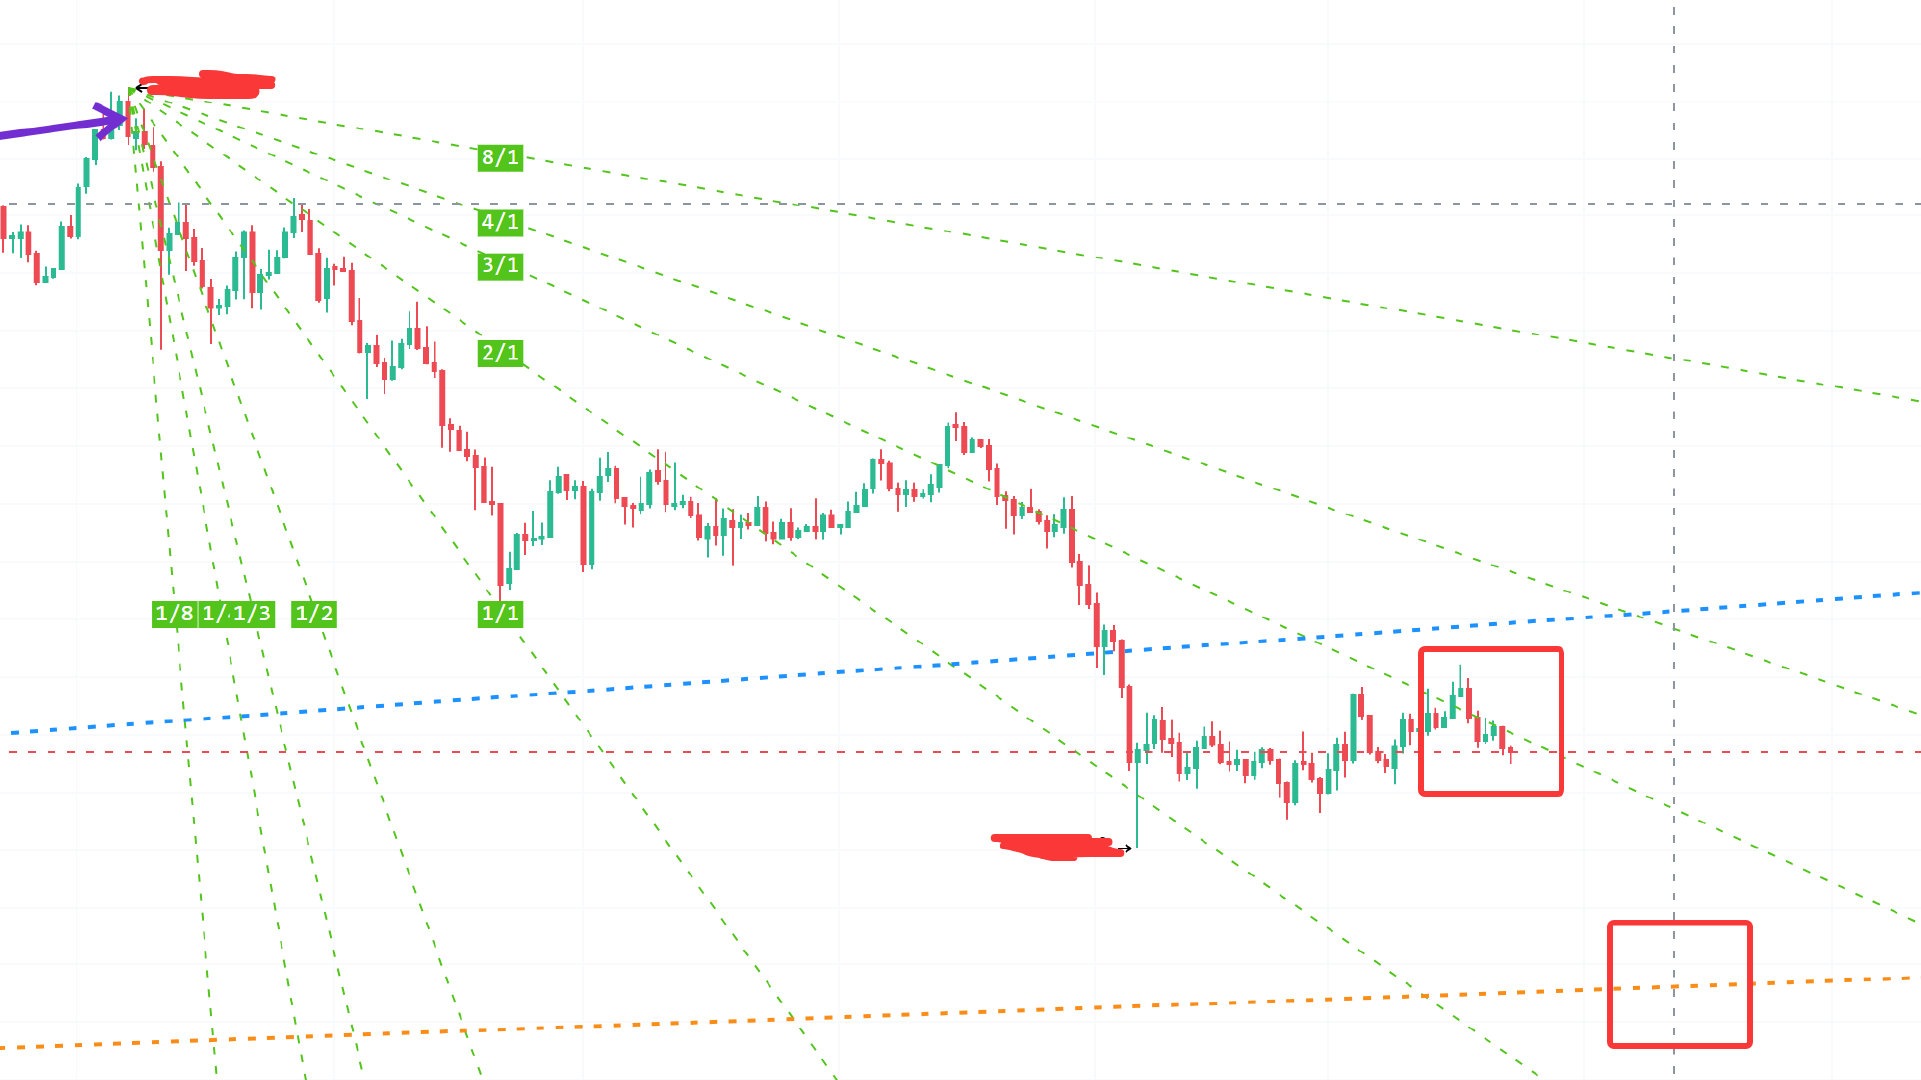
In the short term, pay attention to the resistance of the 1/3 green Gann angle line (which is very tight) and the resistance of the blue Gann angle line.
[Major stage resistance] or [true major resistance of the bear market] pay attention to the resistance of the orange Gann angle line! It is getting closer and closer!
3. Wave theory notes
The 12-hour level of the wave theory center is located at 65.604-68.683 yuan. Maintaining at 65.604 for a long time requires vigilance against a sudden drop of three thousand feet; maintaining at 68.683 for a long time might allow for an upward spike.
4. Wyckoff notes
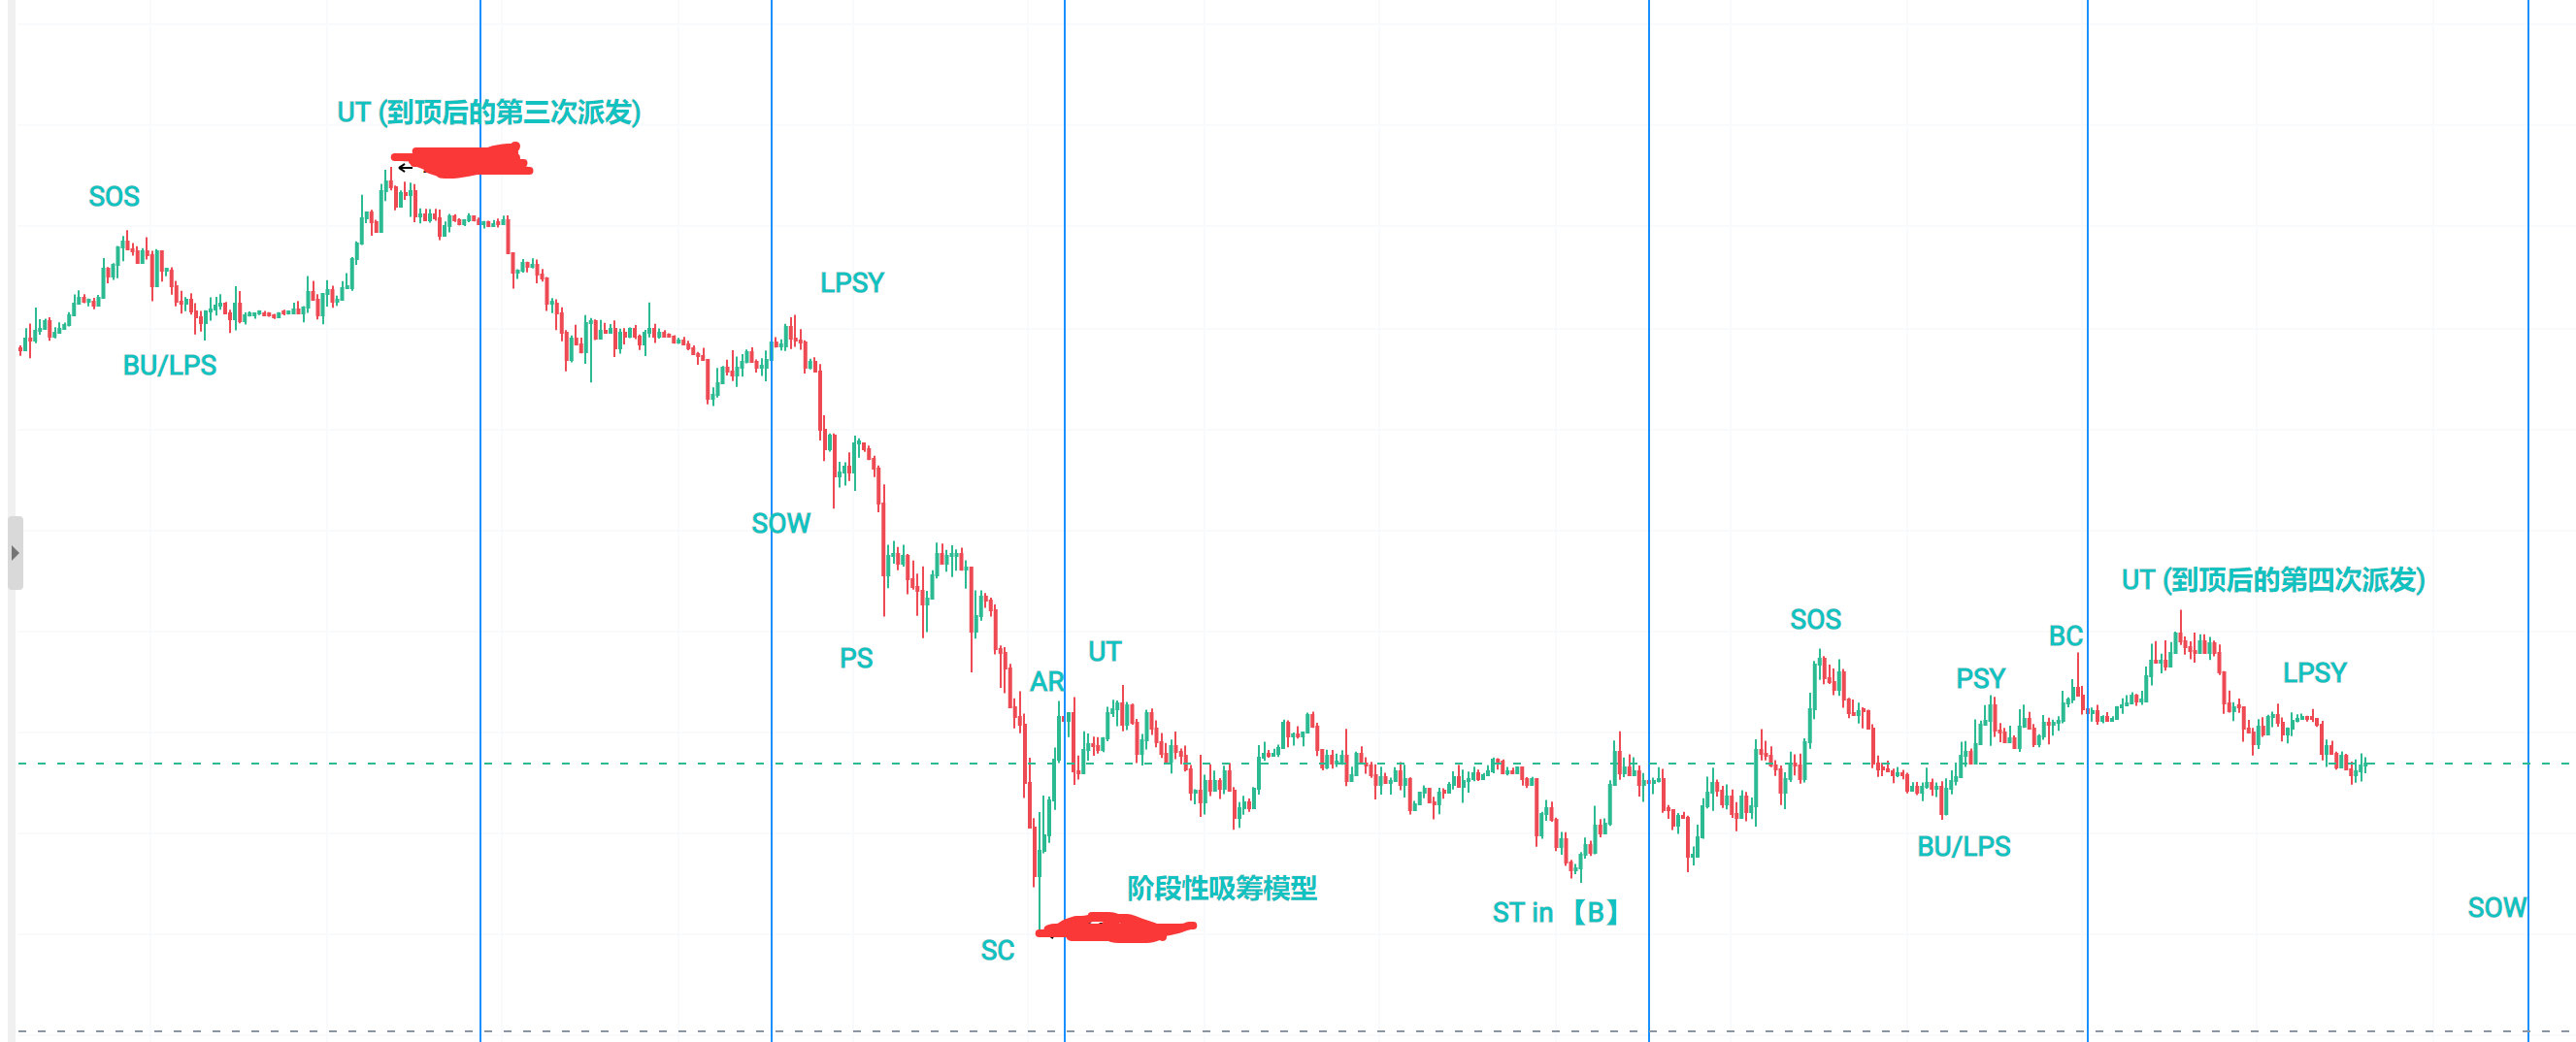
Since October 2025, there have been a total of four distributions, and the fourth distribution began last week! The LPSY high point has appeared, and now we are waiting for the SOW low point.
5. Trend data notes
(1) [Short-term trader's profit|loss|rate] [the focus of focus]
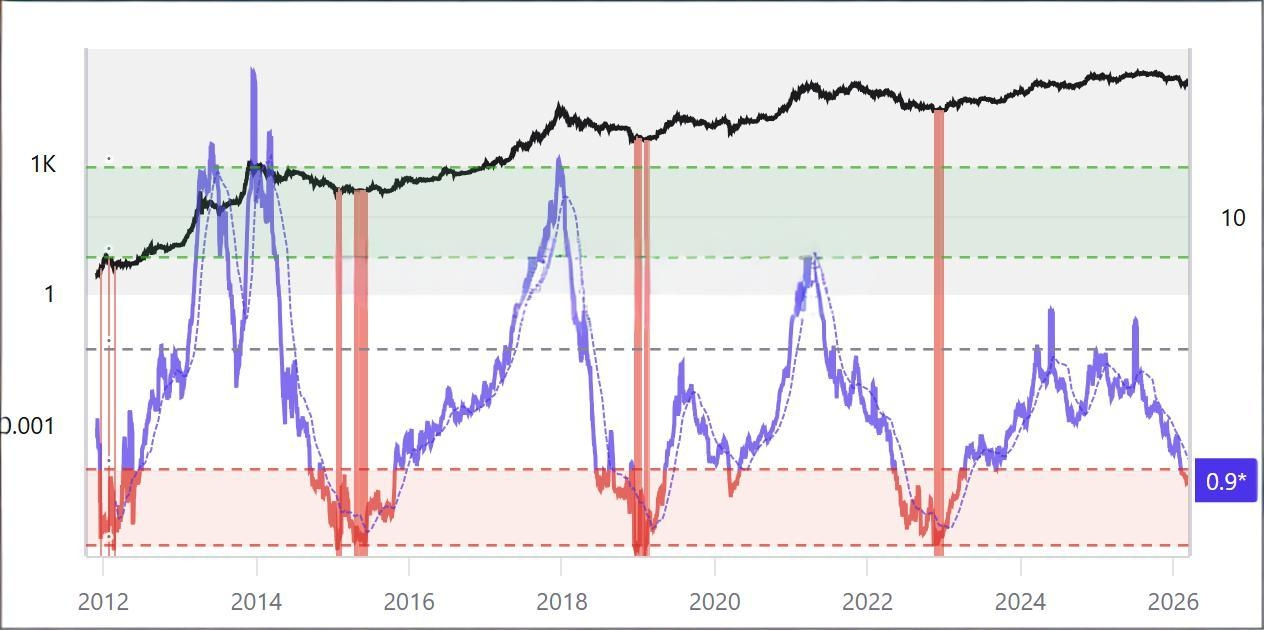
It's very concerning; it had already dropped to 0.8 a while ago, and this week it has risen to 0.9! It needs to be polished! Waiting for it to drop near 0.5 to issue a warning, that is the real major resistance!
(2) [Trader's profit|loss rate] [the focus of focus]
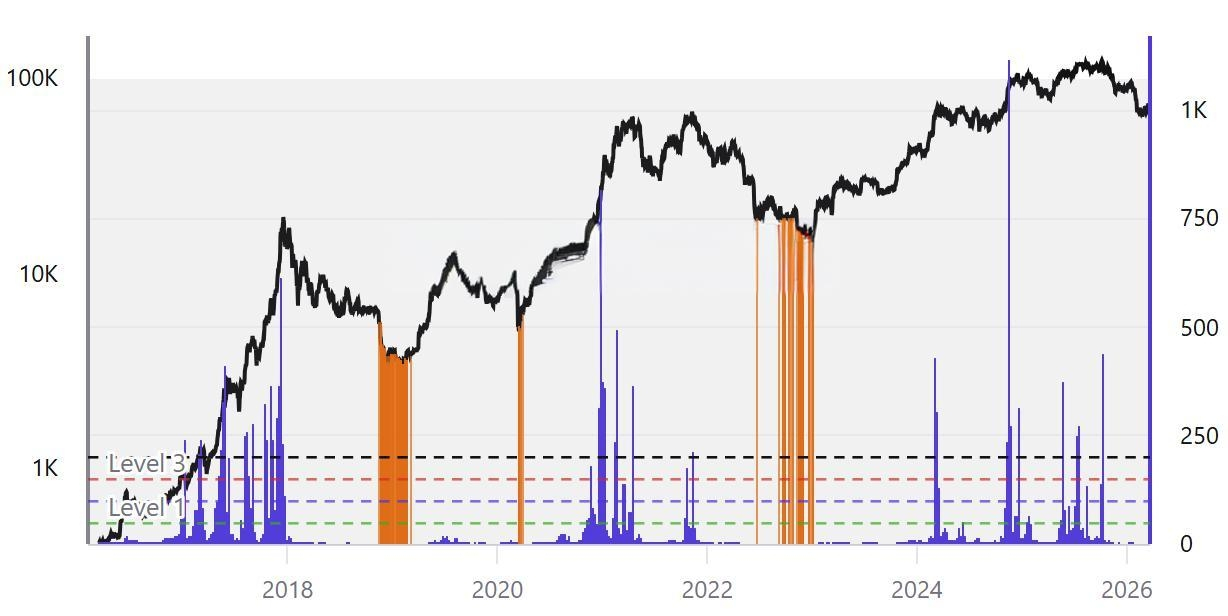
Keep grinding! There hasn’t been a single warning; the previous rounds of bear markets had many warnings! This indicates that we are still far from the real major resistance!
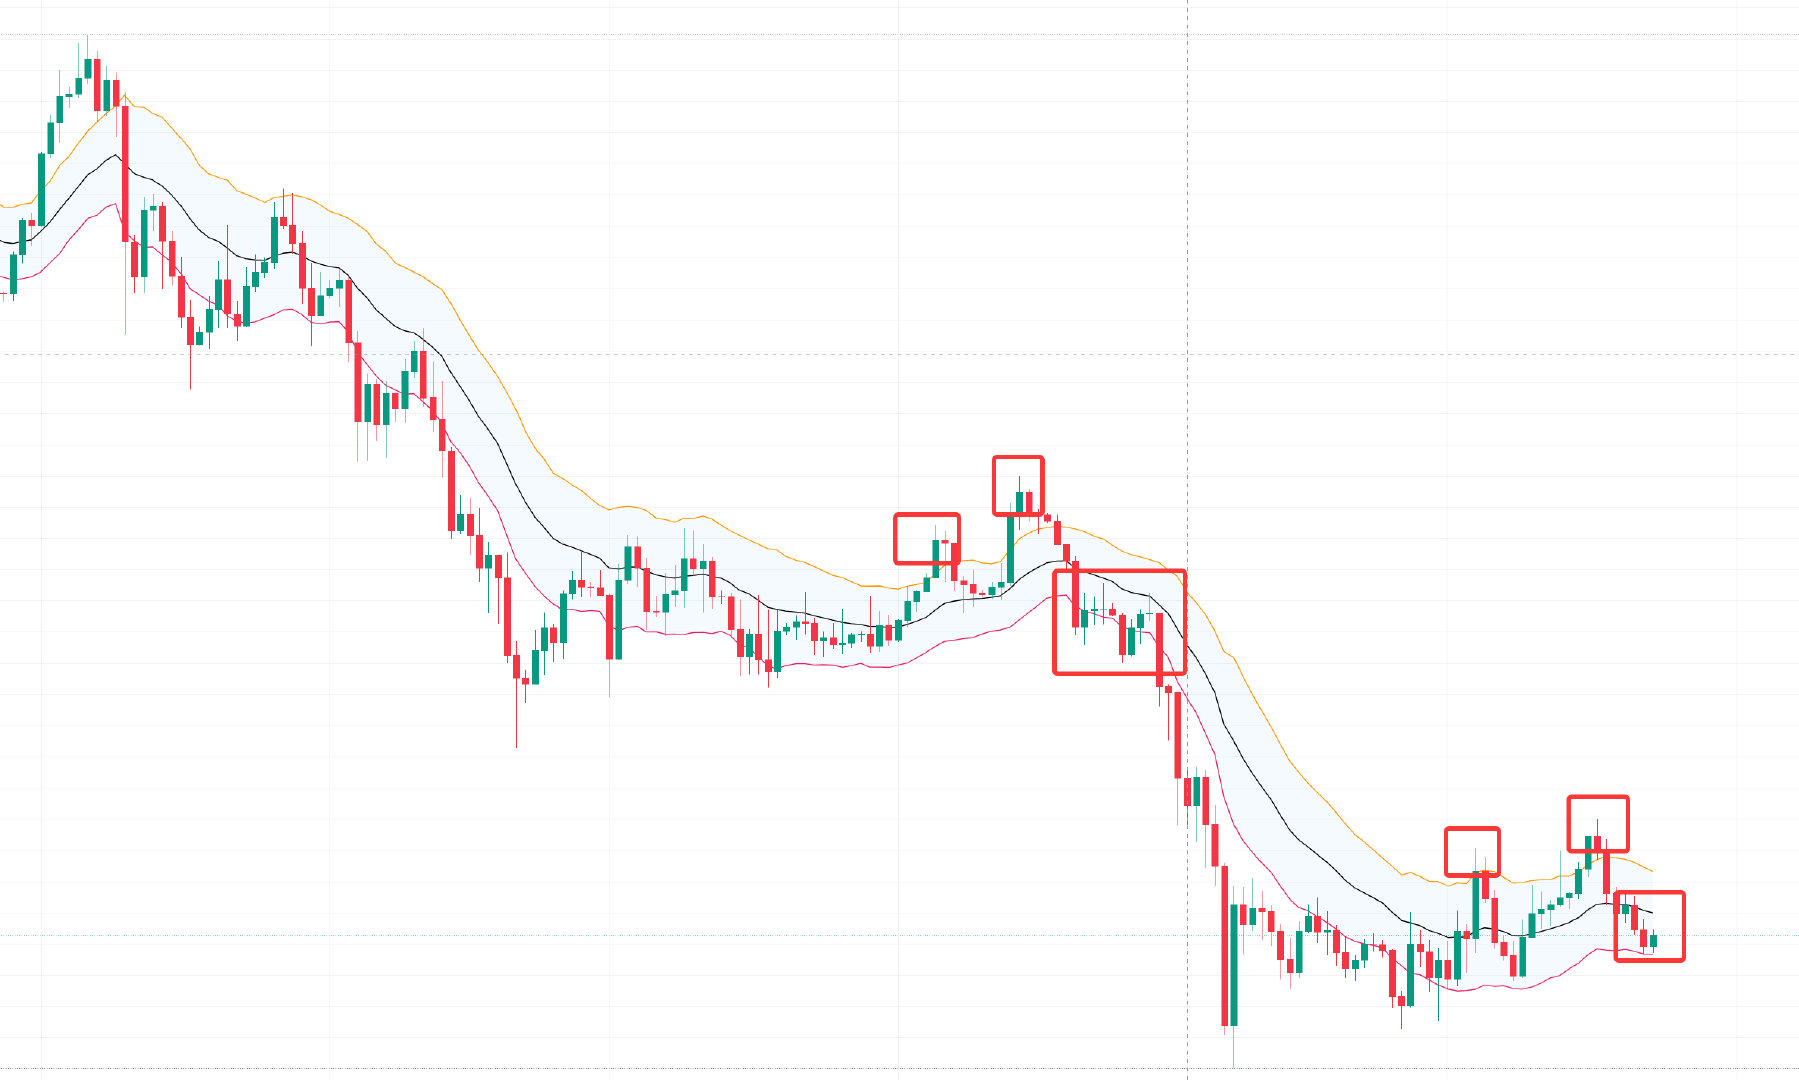
6. Advanced turning point indicators notes
The daily MACD (8 15 6) has crossed down for four consecutive days, and the daily StochRSI and daily SKDJ continue to cross down and are below 20! The possibility of reaching the peak is very high. Here, a valid drop below the daily KC lower boundary for three consecutive days is needed to confirm that we have completely reached the peak!
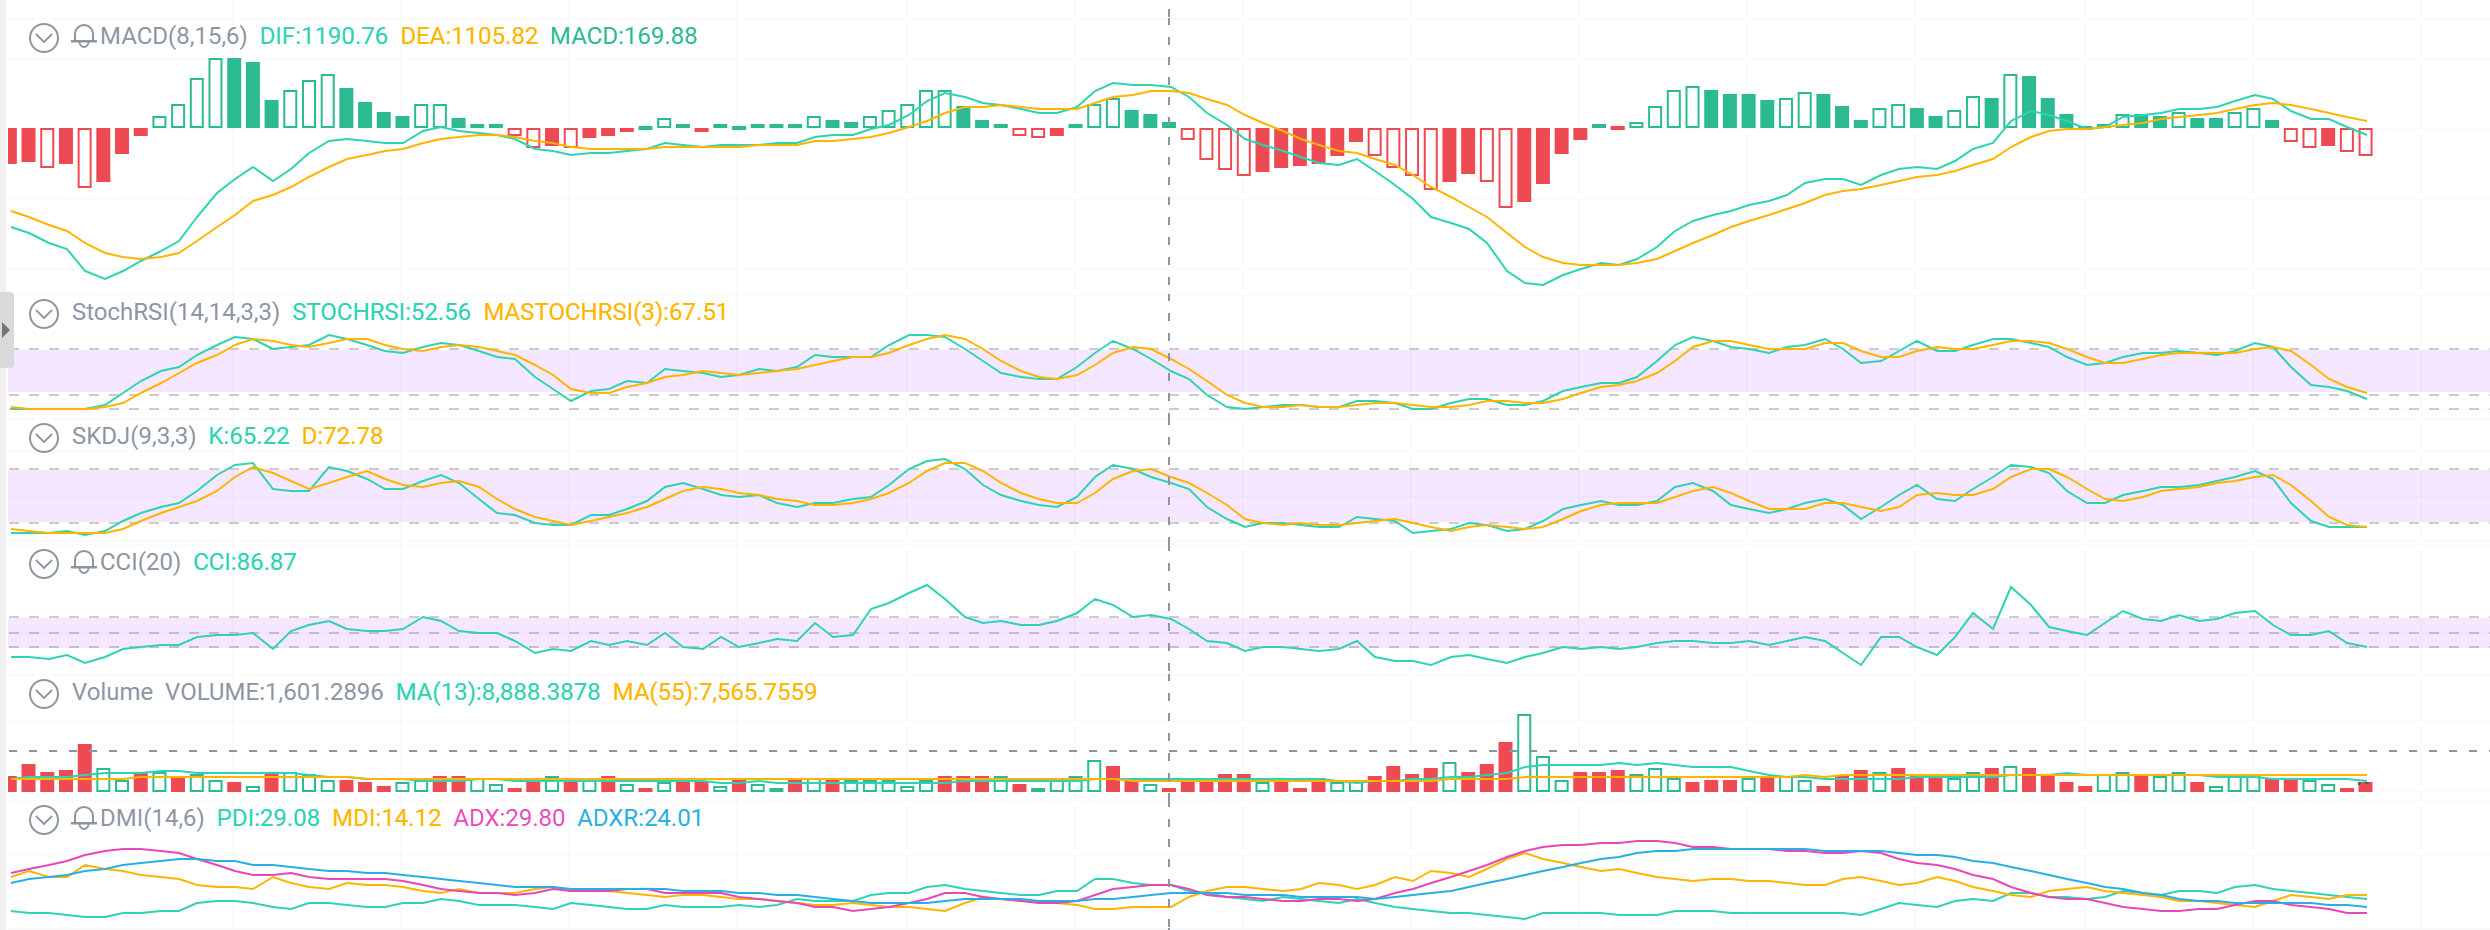
Here, a valid drop below the daily KC lower boundary for three consecutive days is needed to confirm that we have completely reached the peak!
The daily volume needs a significant drop before it can be considered a stage of major resistance!
Five, learning notes on A-shares! The sky has fallen!
No one supports your aspirations; A-shares send you to the western heaven! Isn't that ironic!
From the perspective of wave theory, the wave that started in September 2024 for A-shares is actually not a bull market, but a significant rise within a bear market. The real bull market starts from this golden pit! This golden pit is the beginning of a 10-year long bull market!
Currently in the super cycle 2-Z wave or super cycle 4-E wave!
How much longer will the bear last? The fastest it can end is in April this year; if it takes longer, it may last until June or even September! The worst-case scenario is that it will last more than a year.
The key to ending the bear market is the Middle East peace! At the same time, we need to see when the beautiful stocks reach resistance, which is very important! Global assets are interconnected!
Where will it drop to? Let's look at it with a logarithmic coordinate; ideally, it is at the lower edge of the Atley channel, which is approximately 3200-3250! Doesn't that feel cool to the heart? These two years have been in vain!
If you use a linear coordinate, it feels cooler; ideally, it is at the lower edge of the Atley channel, which is approximately 3000-3040.78! Oh my!
To avoid being too alarmist, we will temporarily use a logarithmic coordinate to count the waves; the latest detailed wave trend is as follows:
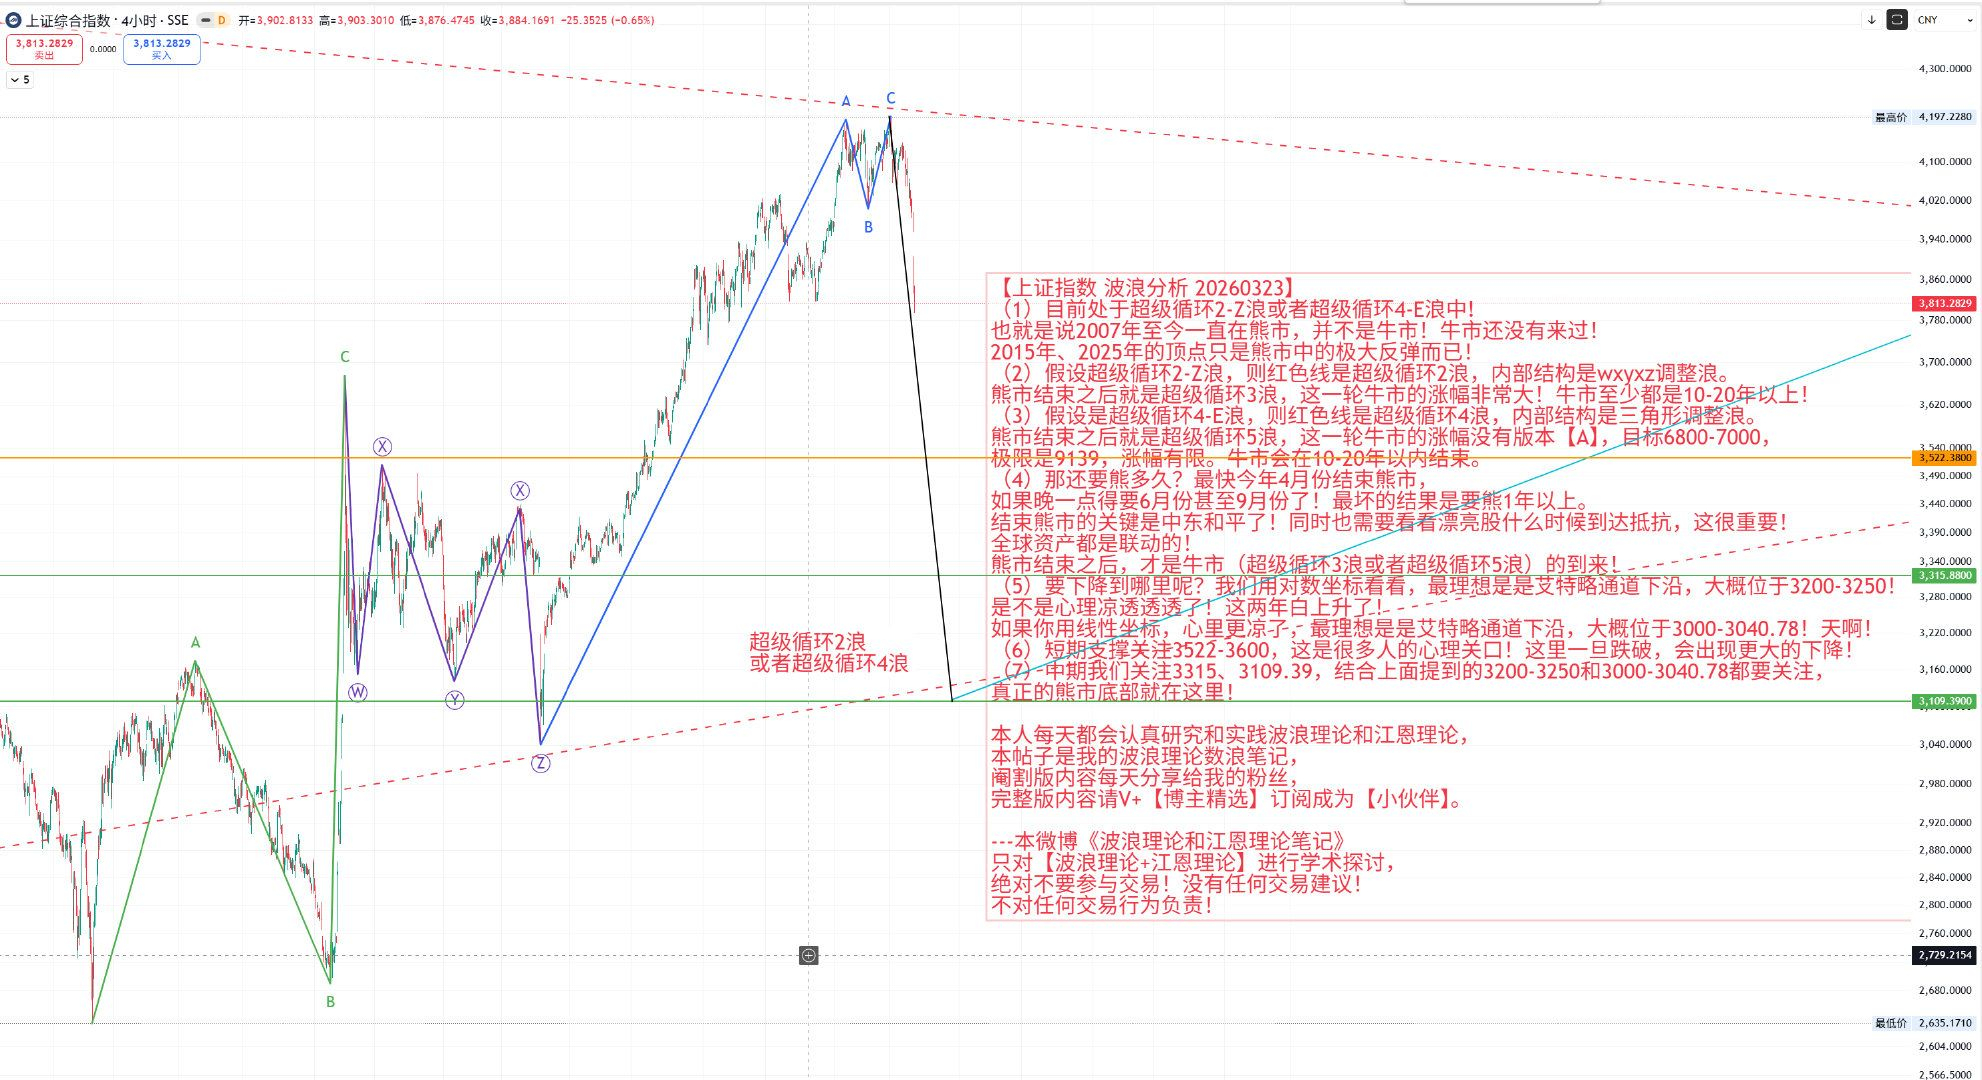
The sky has fallen! 3315, 3200-3250, 3109.39, 3000-3040.78! Cherish every moment!
Six, learning notes on the US stock market
The latest analysis of the US stock market is as follows:
Pay attention to when the US stock market reaches major resistance, which is very important! Global assets are interconnected! When the US stock market reaches major resistance, the A-share market will also reach major resistance!
This bear market in the US stock market lasts about 3-10 months, and it can last up to a year! This means the bear market may end as early as April!
Seven, learning notes on gold
No one supports your aspirations; gold sends you to the western heaven! Isn't that ironic!
The wave analysis charts provided last week were all correct! #黄金走势分析
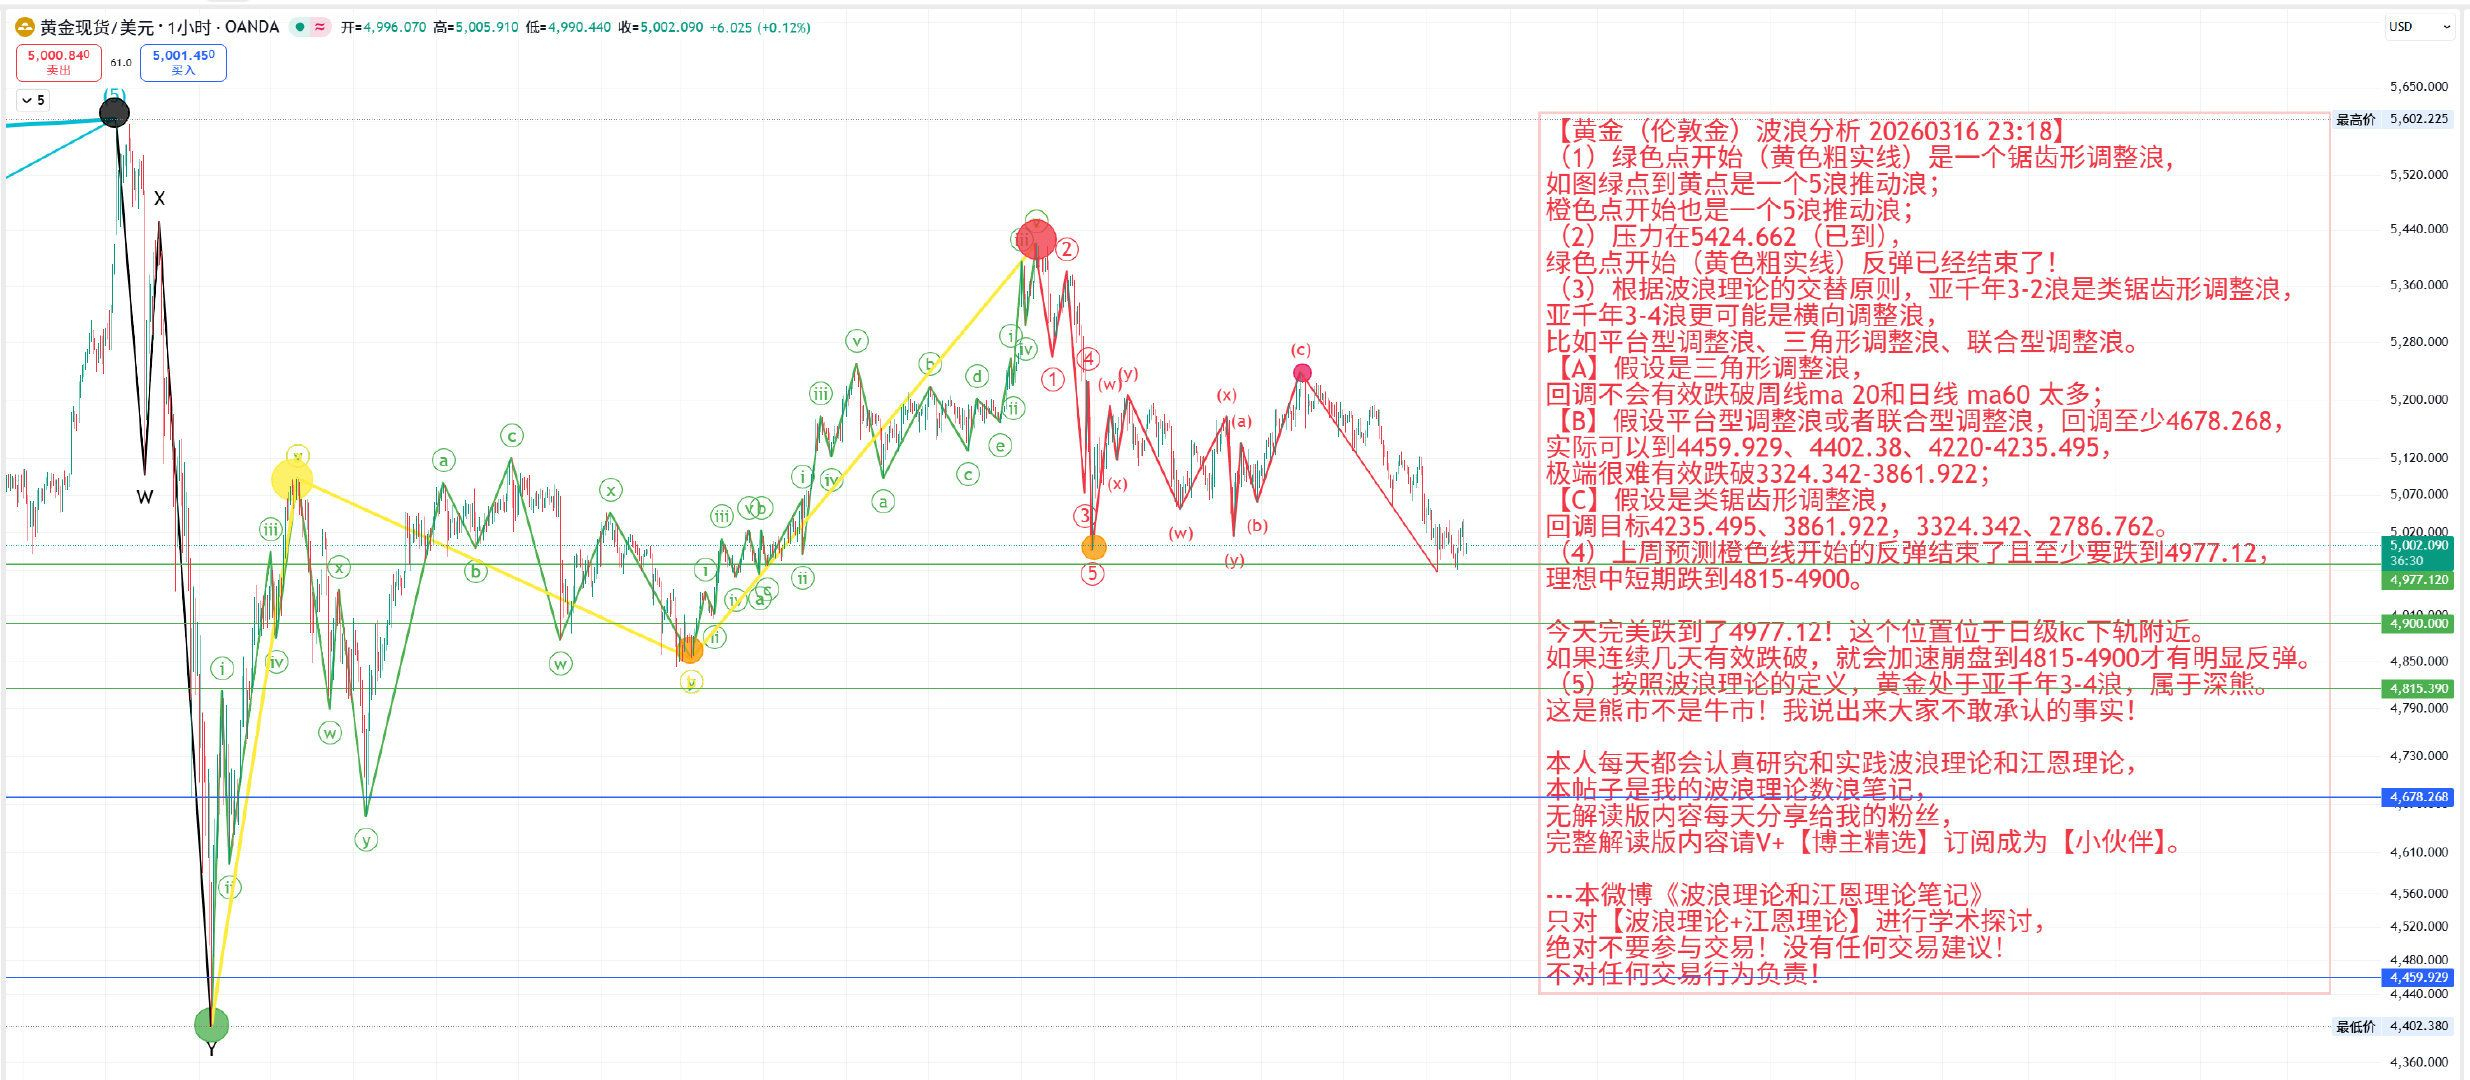
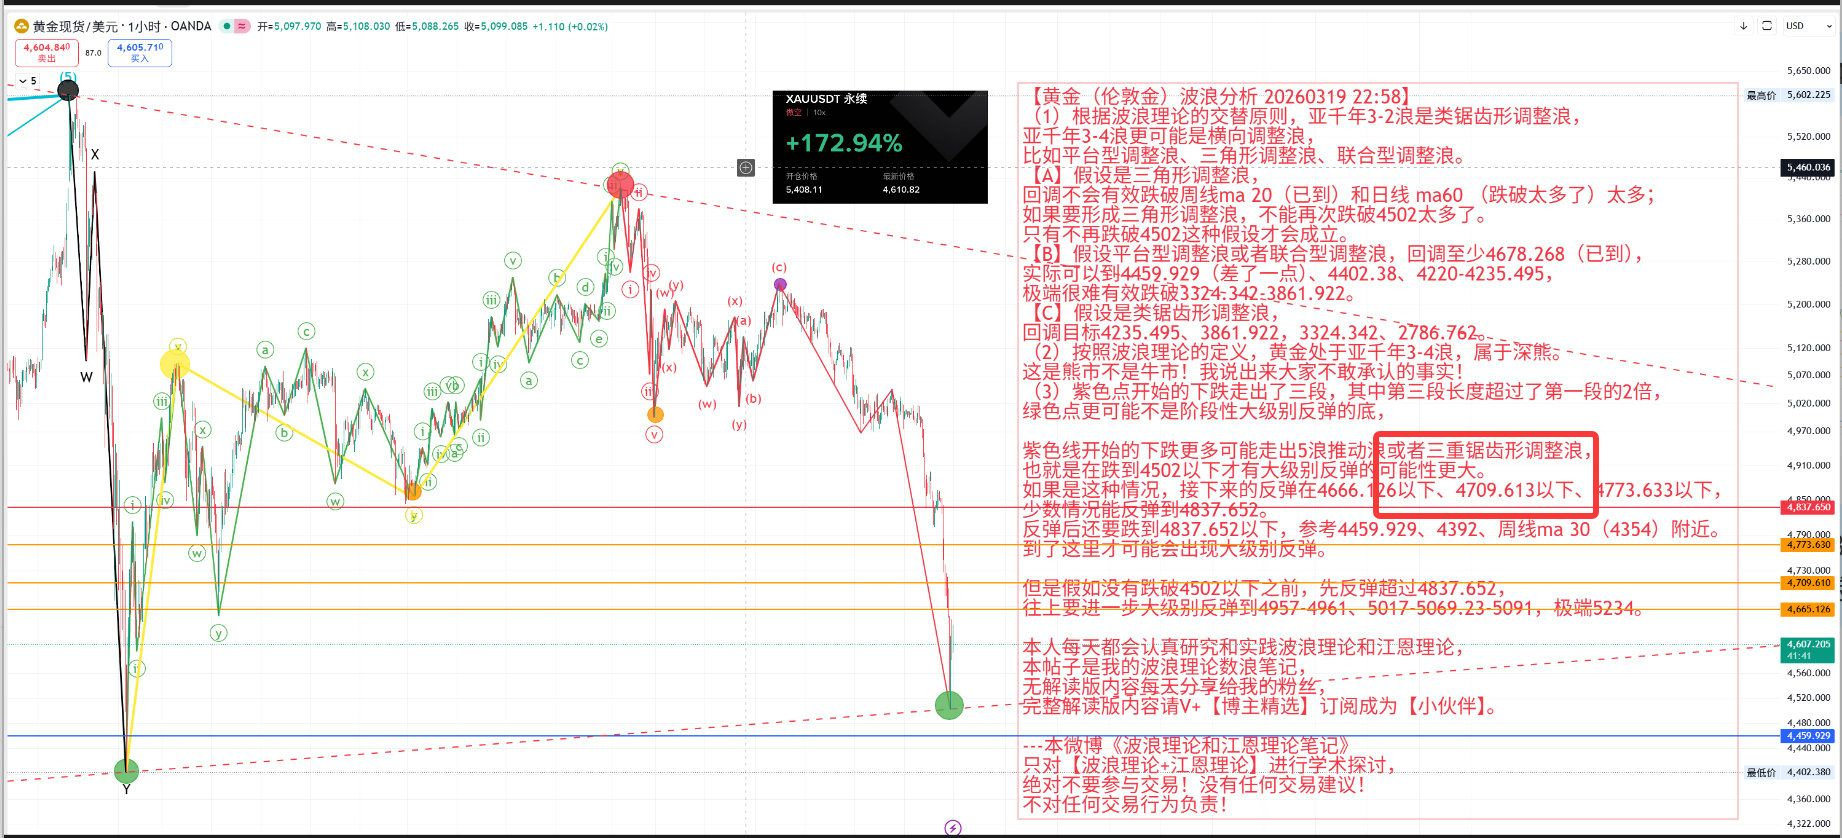
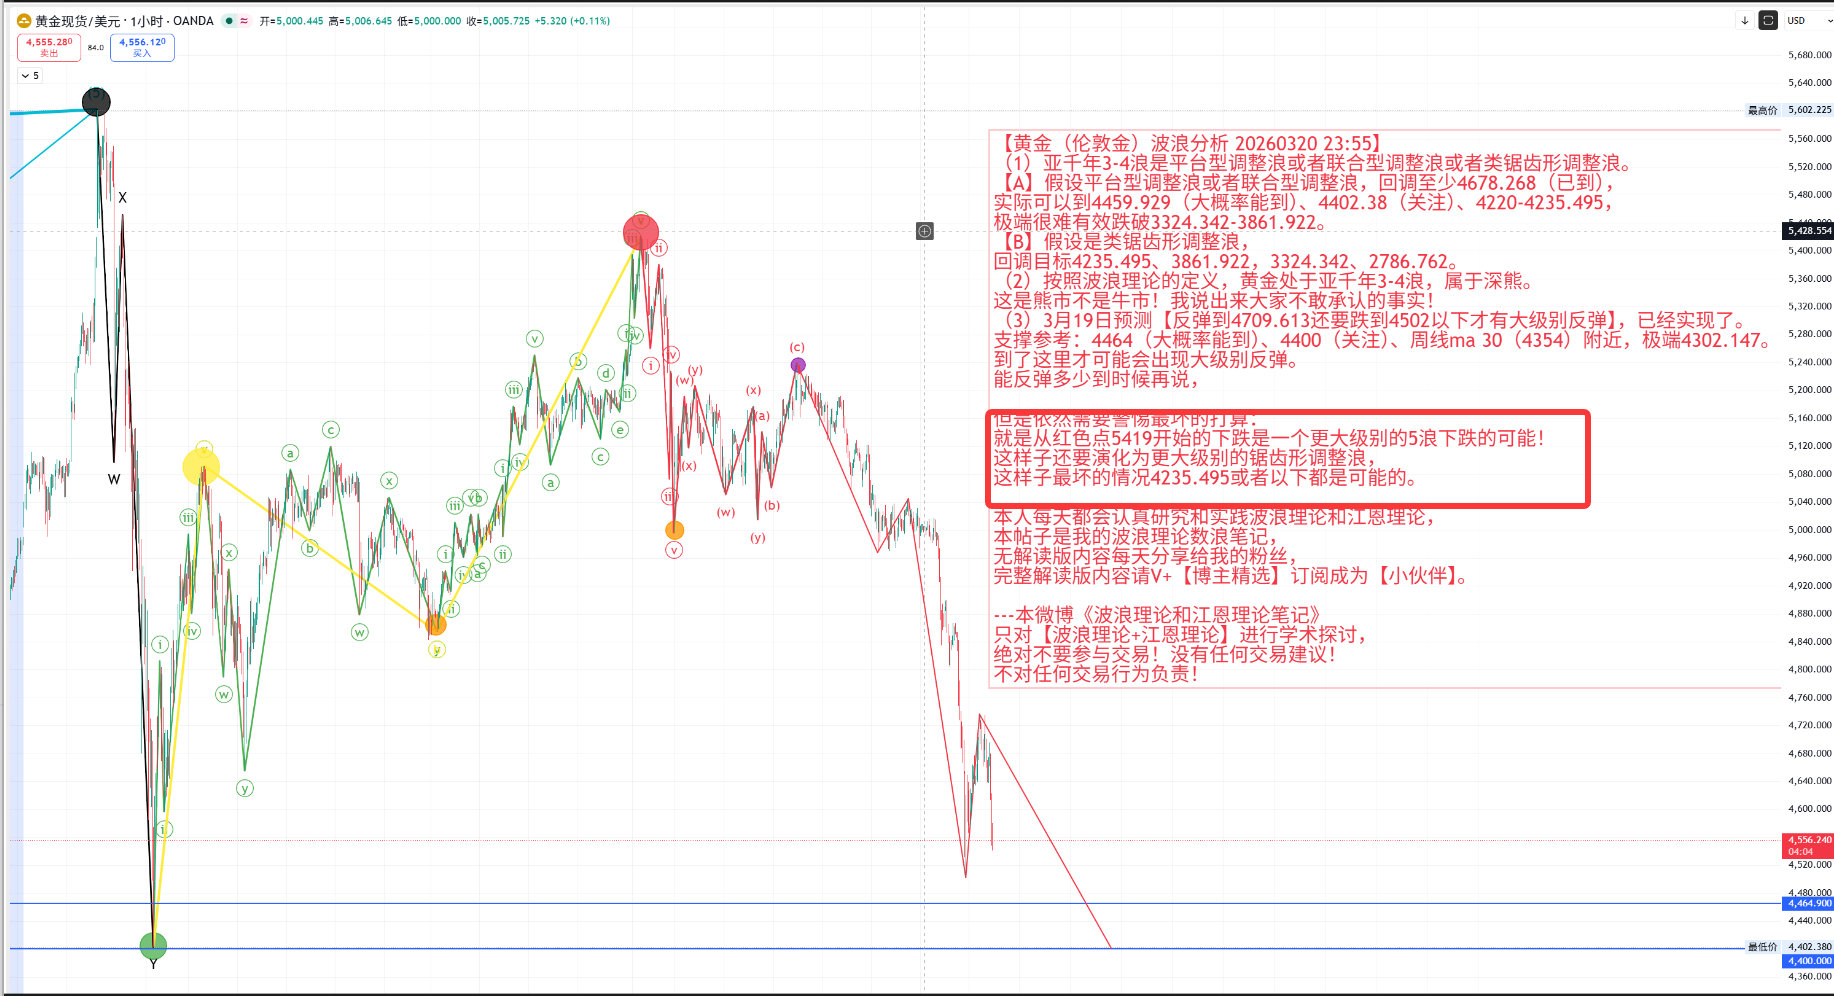
Is it at a stage of resistance? The latest analysis chart is as follows:
Eight, learning notes on silver
No one supports your aspirations; silver sends you to the western heaven! Isn't that ironic! #白银走势分析
The wave analysis charts provided last week were all correct!
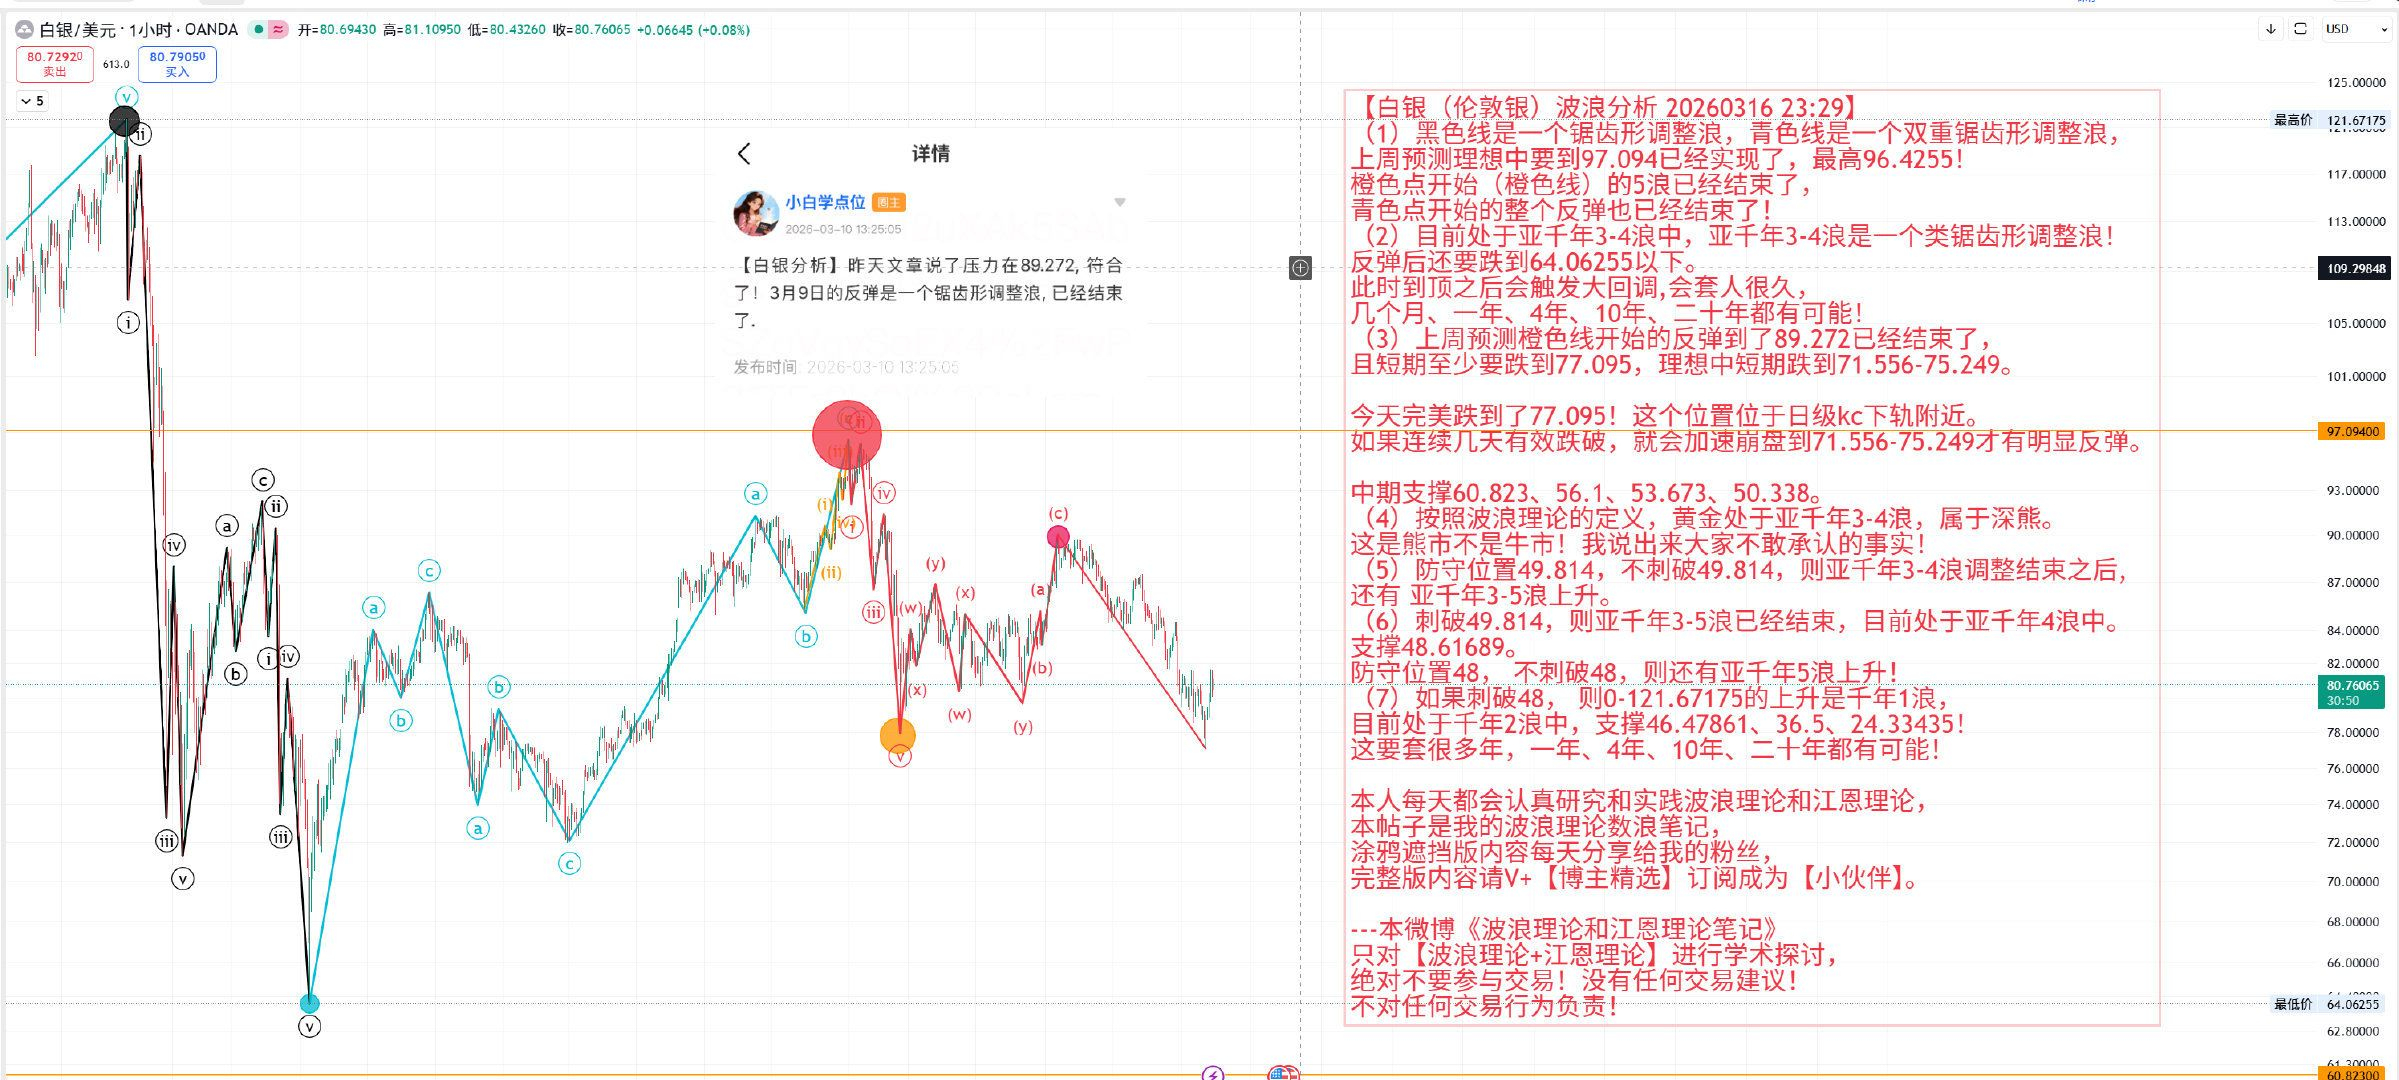
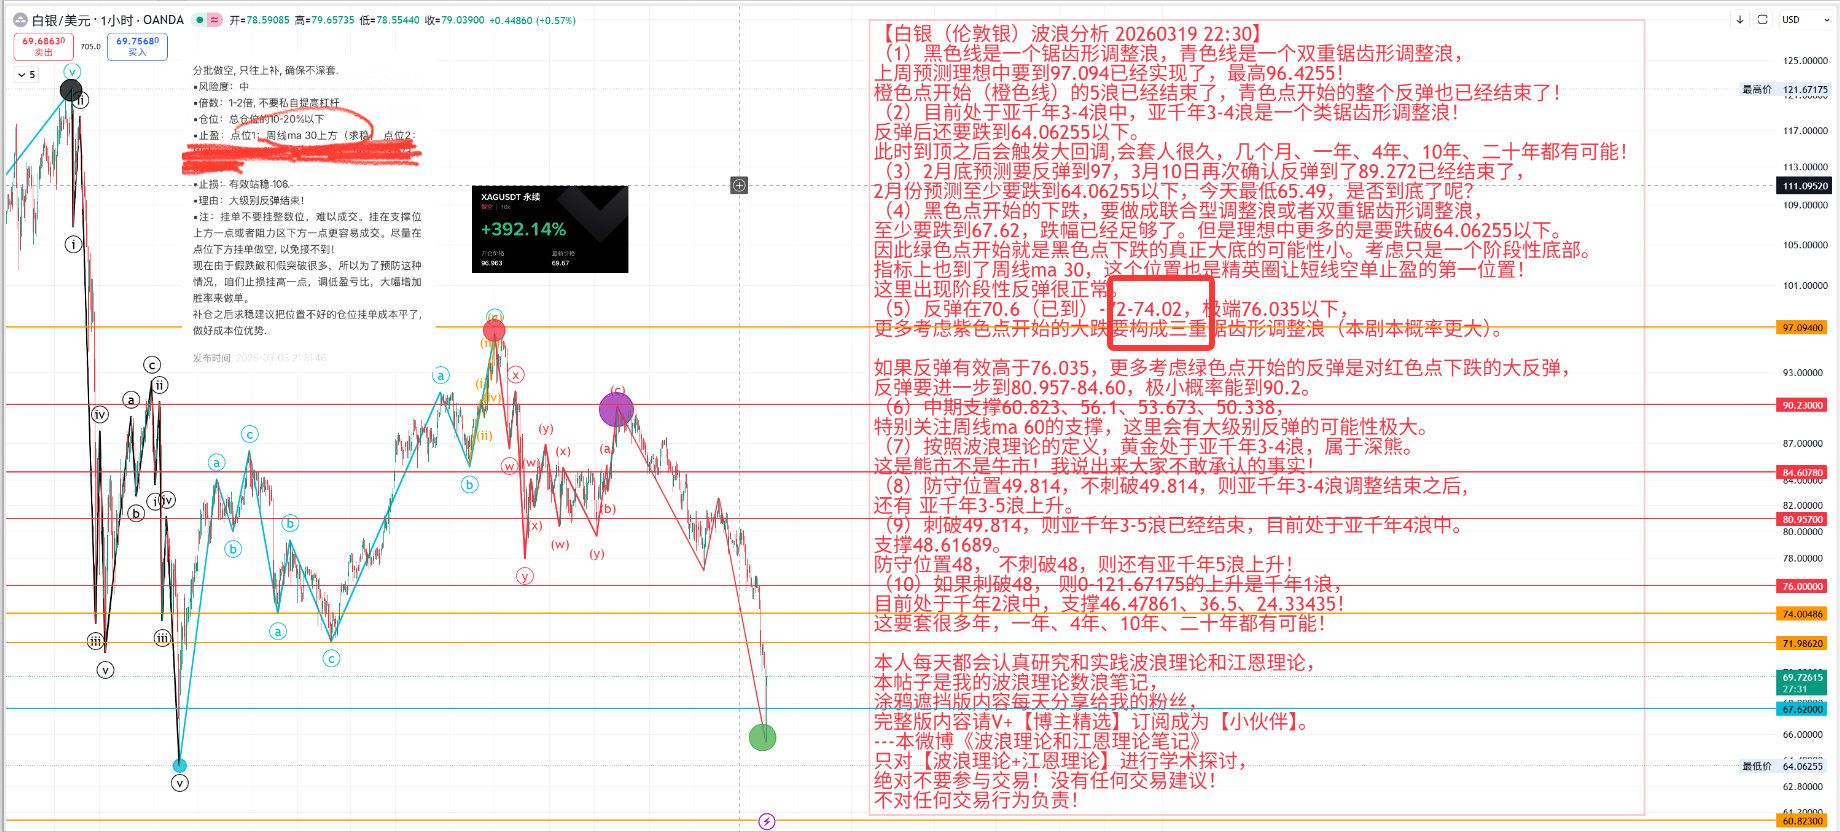
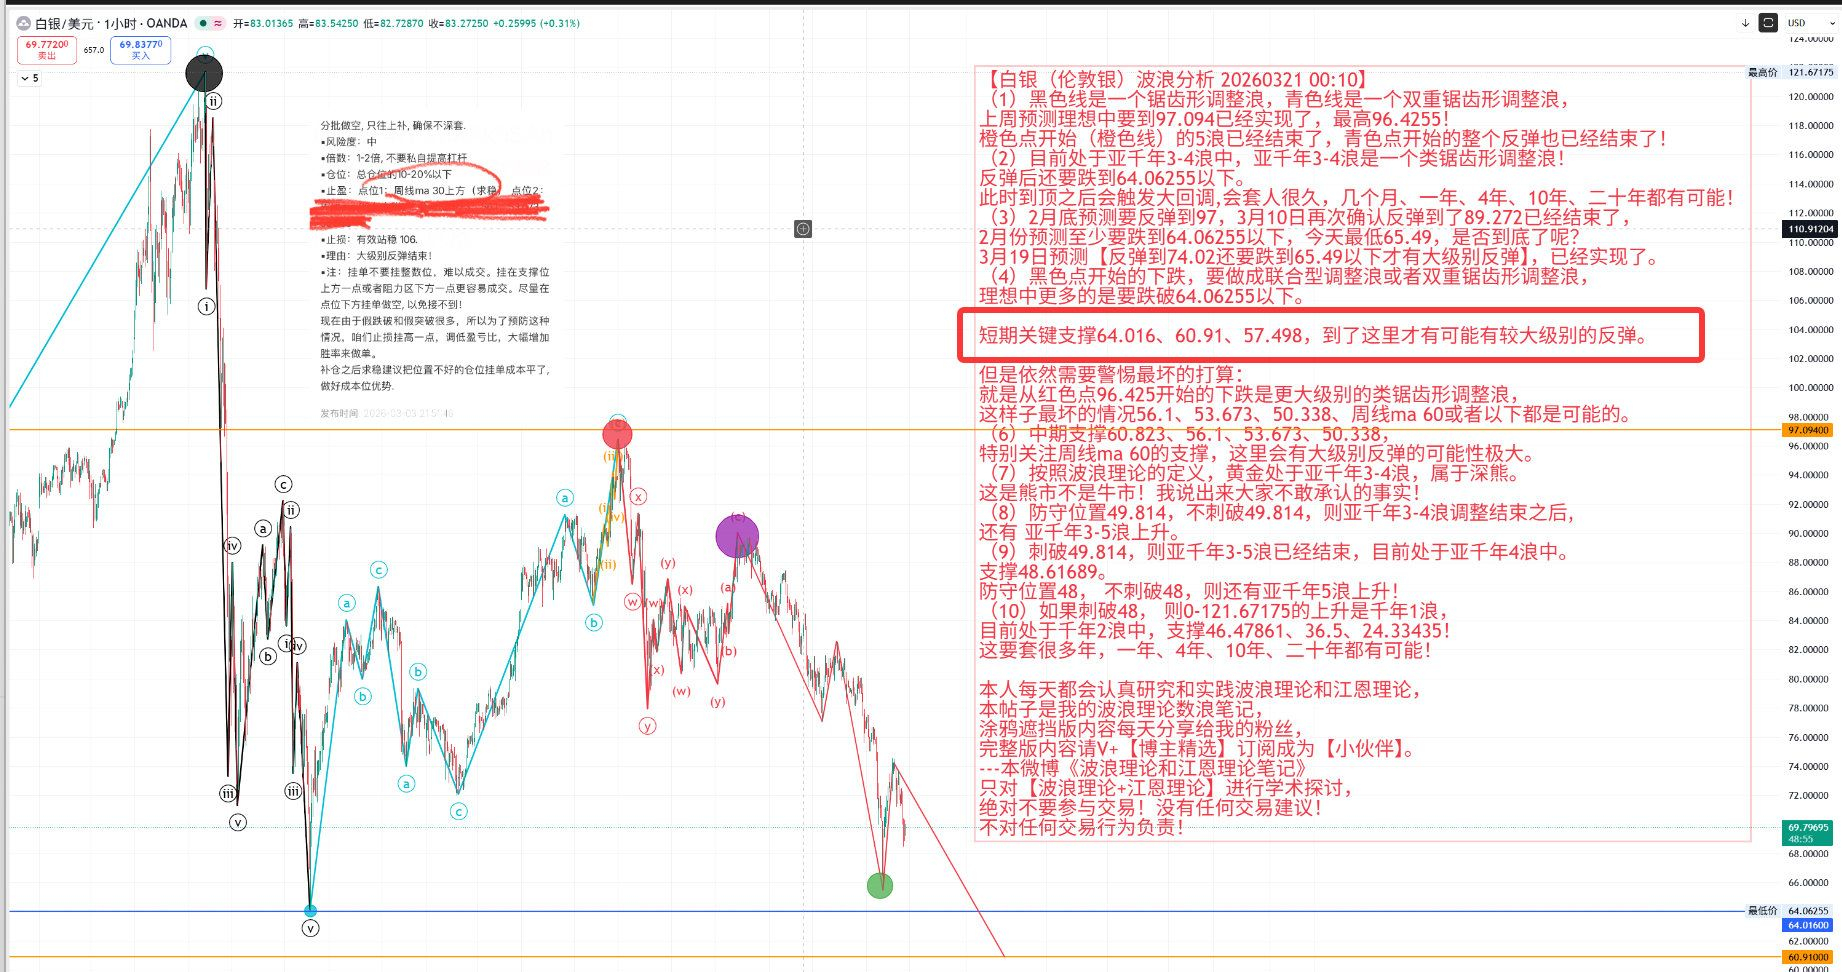
Is it at a stage of resistance? The latest analysis chart is as follows:
Nine, Ethereum ETH trend analysis
Last week I predicted that the weekly BBI would peak at 23.77-23.95, which fully met expectations!
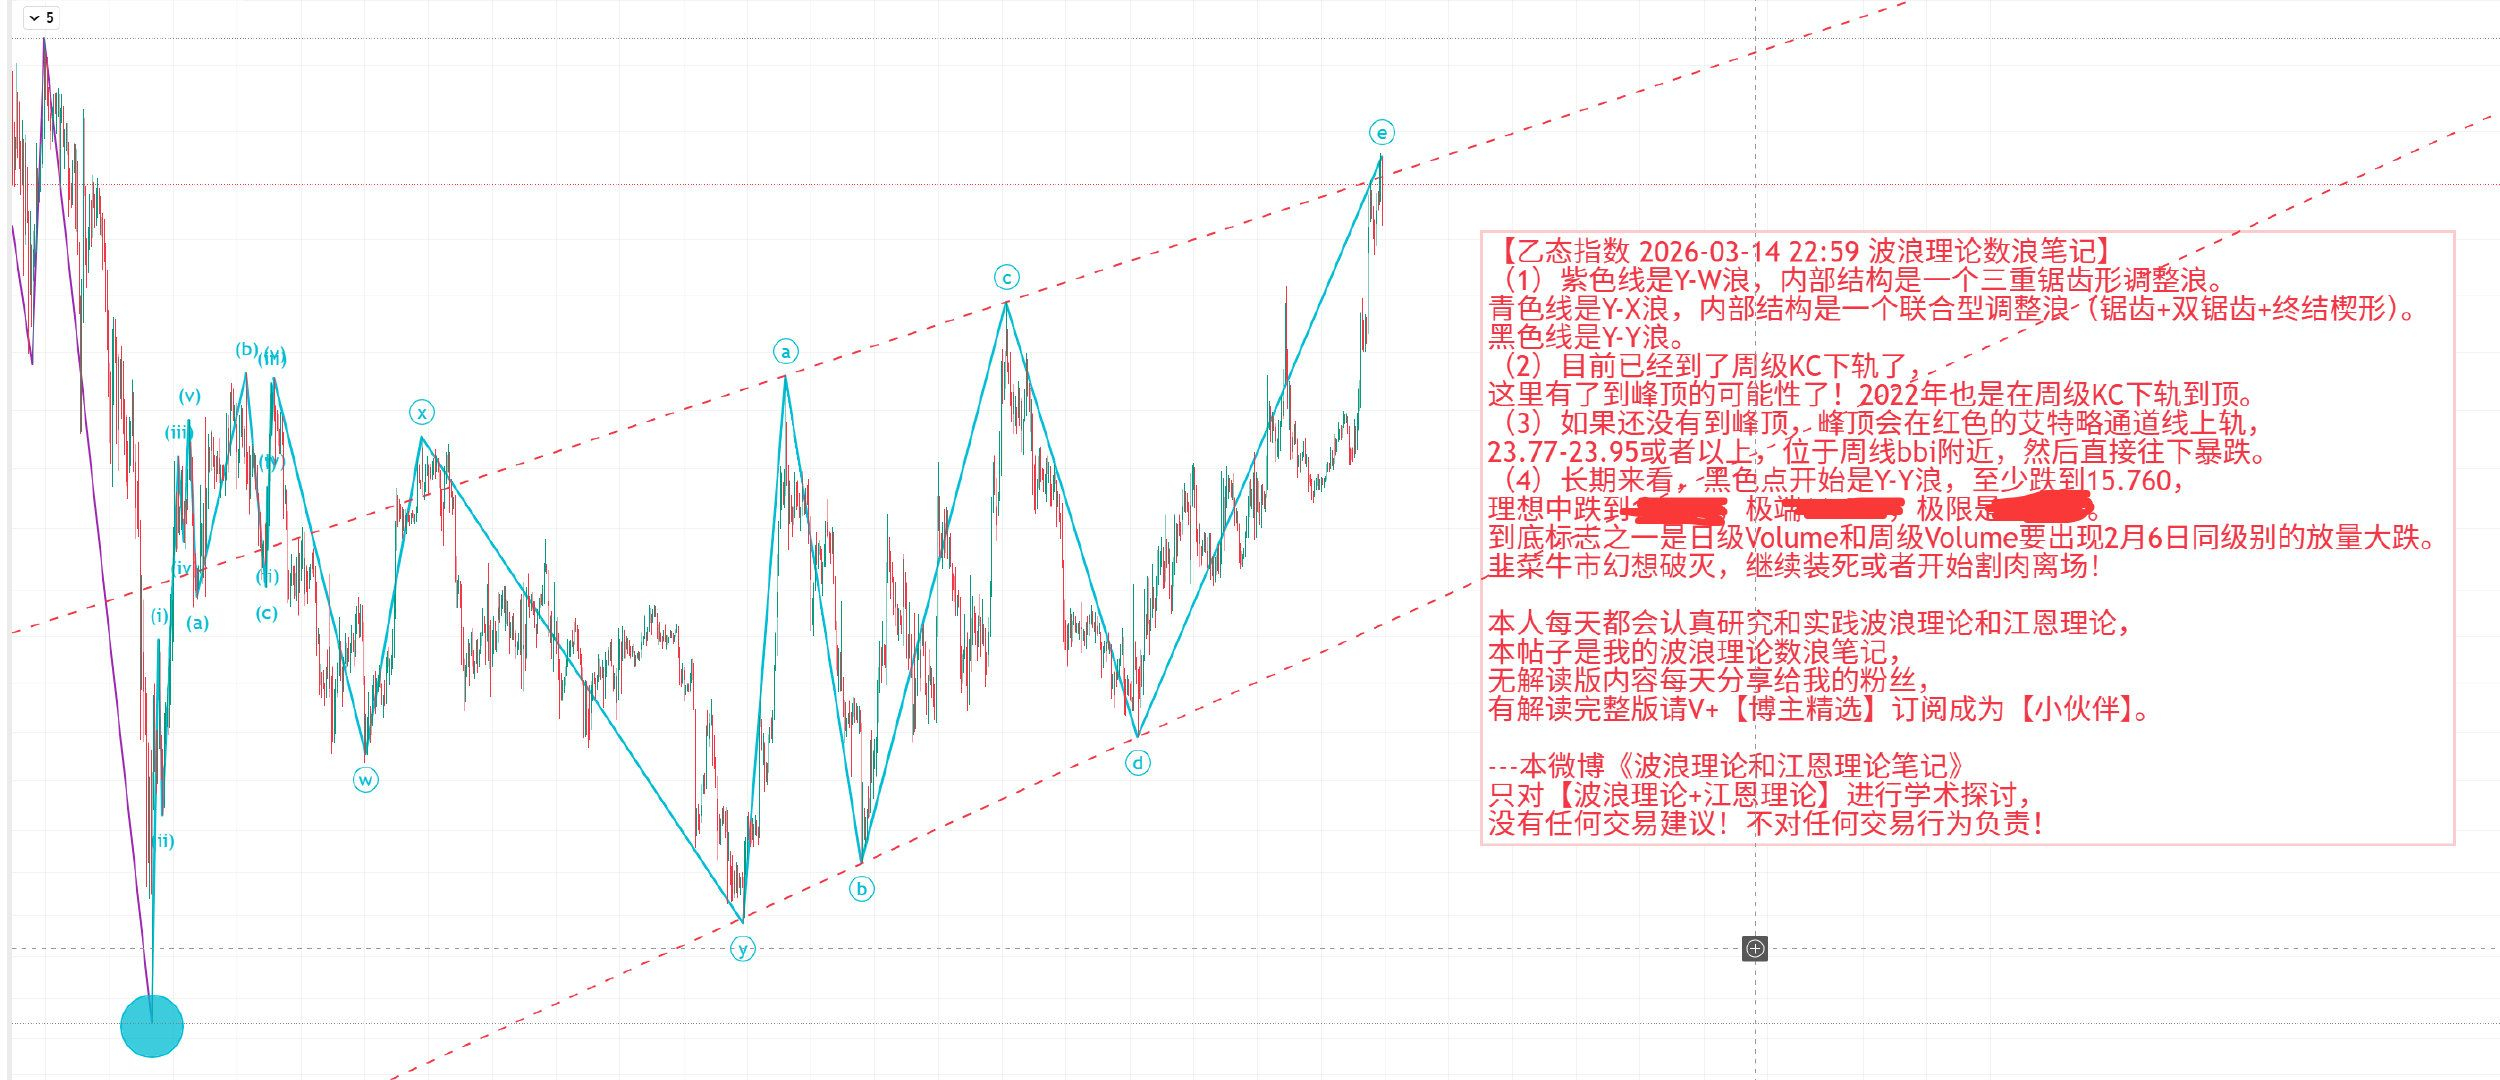
From now on, the subsequent wave theory notes on [eth] with [interpretative version] will require you to study the wave theory on your own in conjunction with the analysis of [btc].
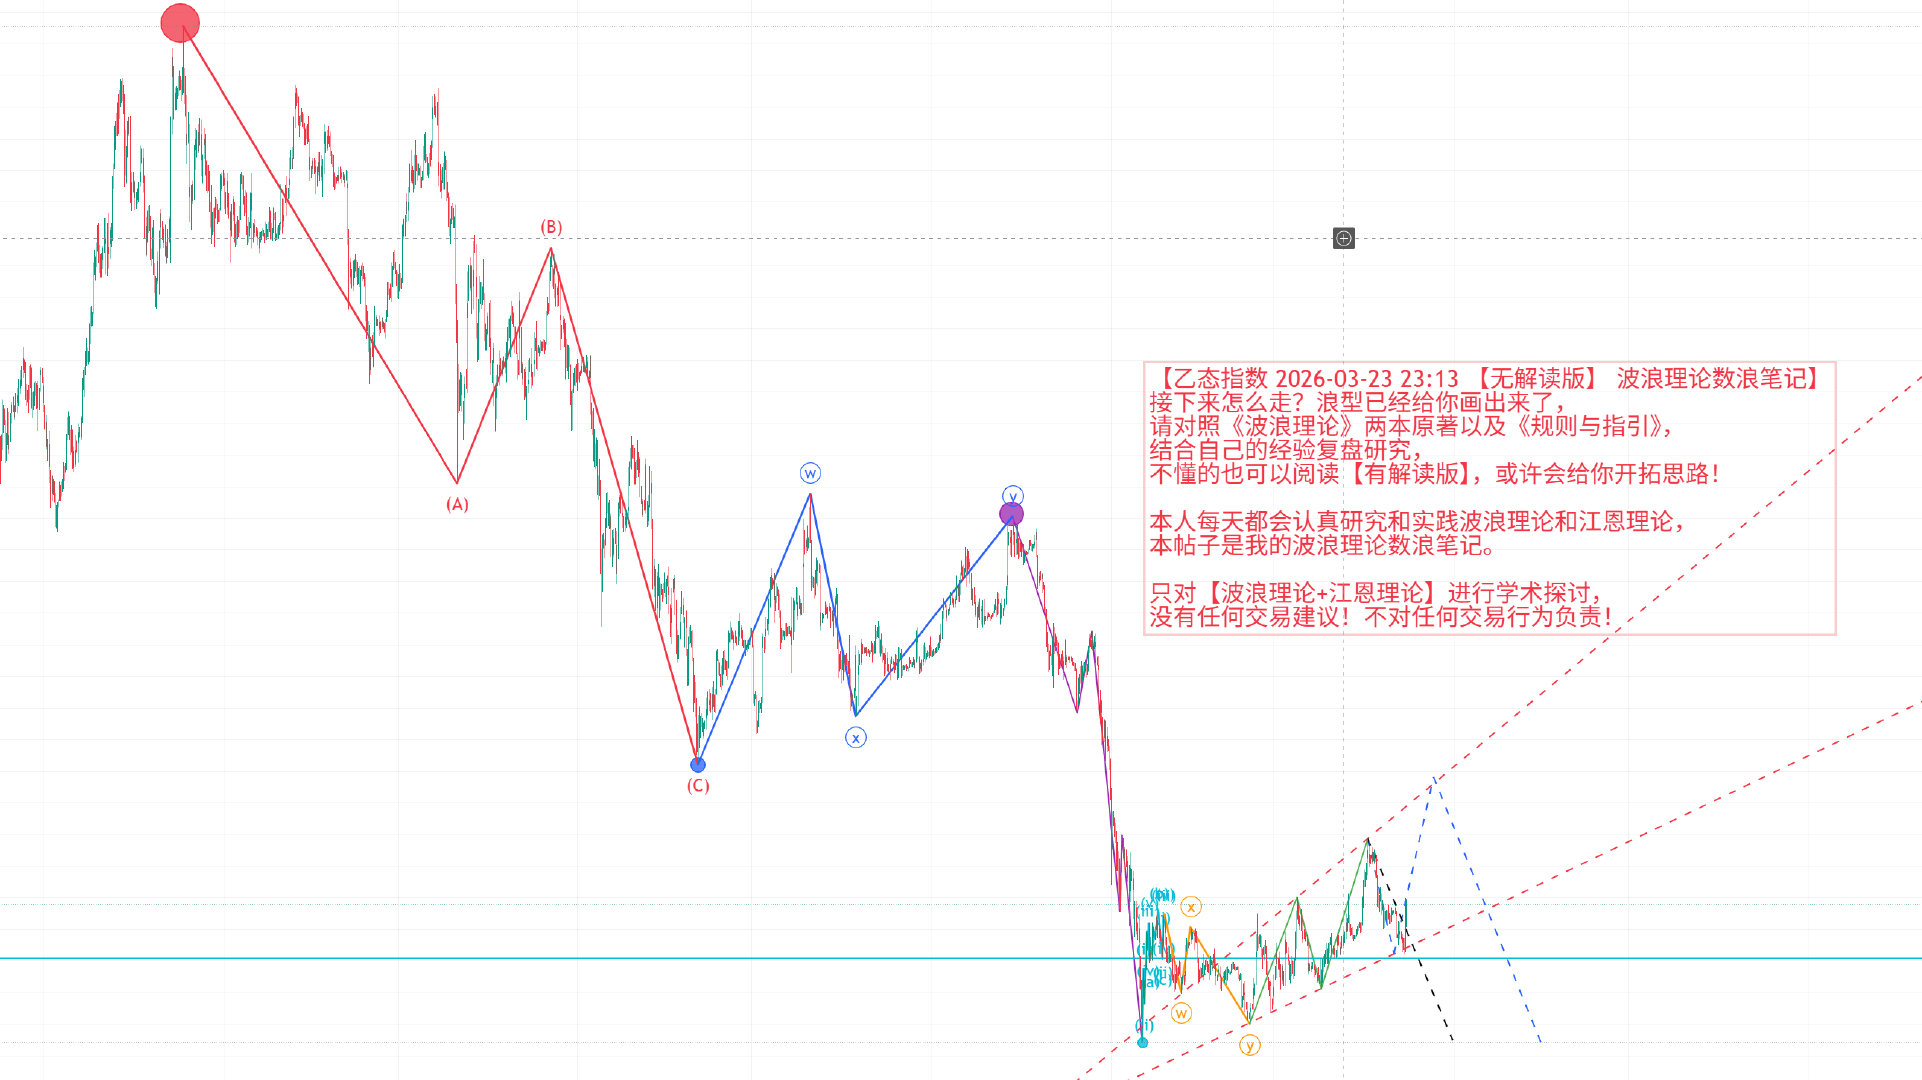
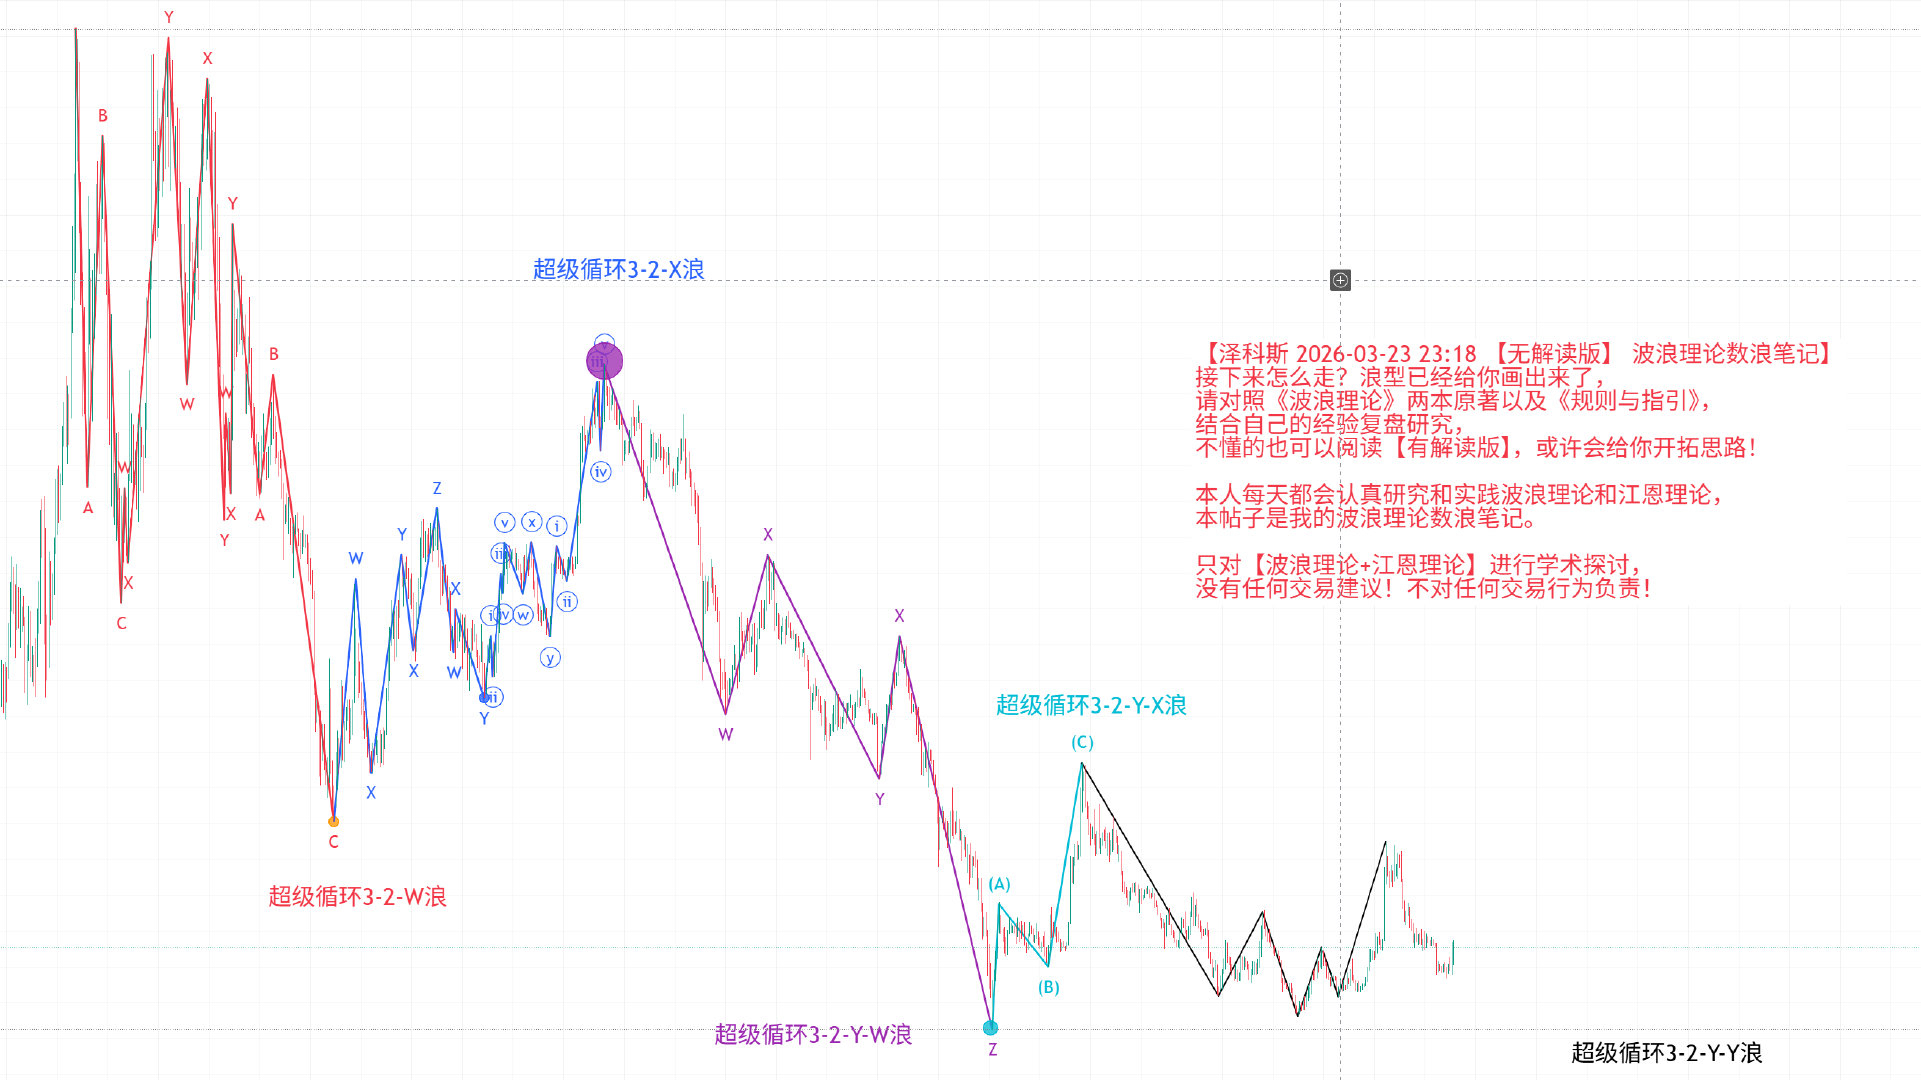
Ten, learning notes on ZEC
From now on, the subsequent wave theory notes on [ZEC] with [interpretative version] will require you to study the wave theory on your own.
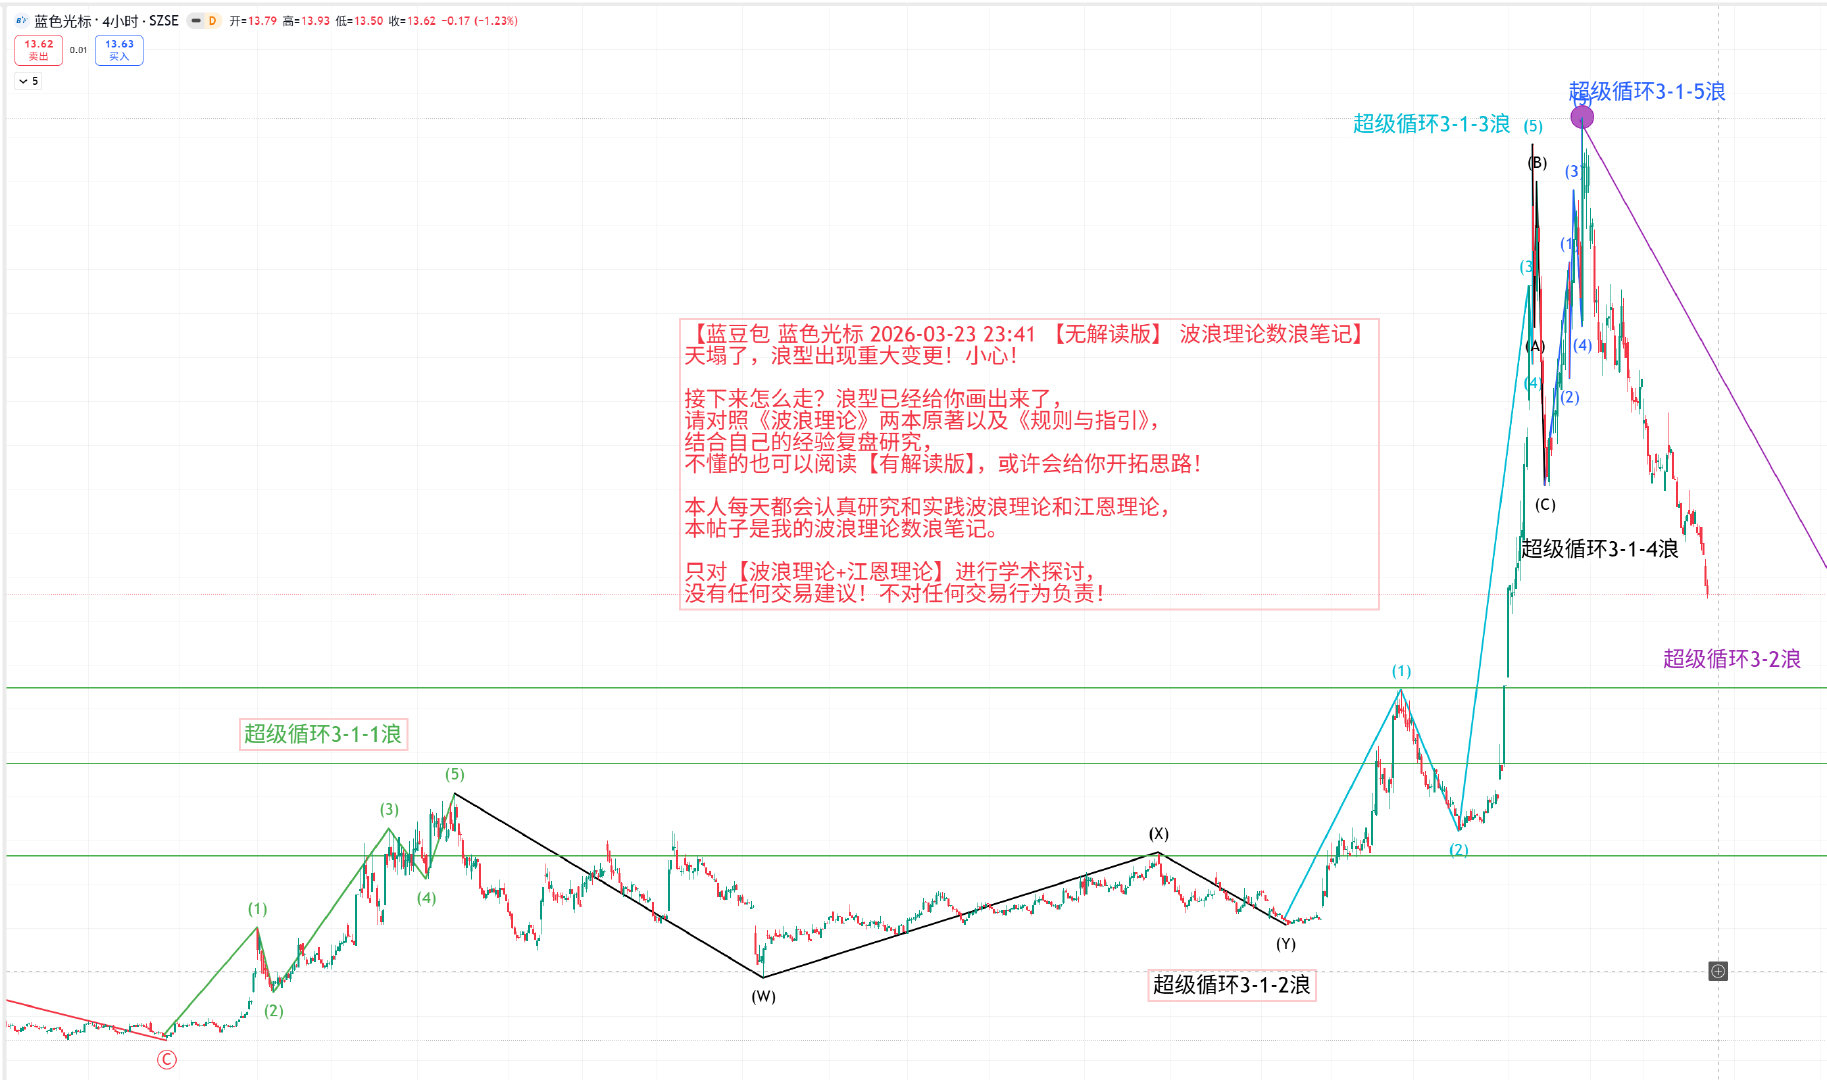
Eleven, learning notes on BlueFocus
The wave pattern has undergone significant changes; be careful!
From now on, the subsequent wave theory notes on [BlueFocus] with [interpretative version] will require you to study the wave theory on your own.
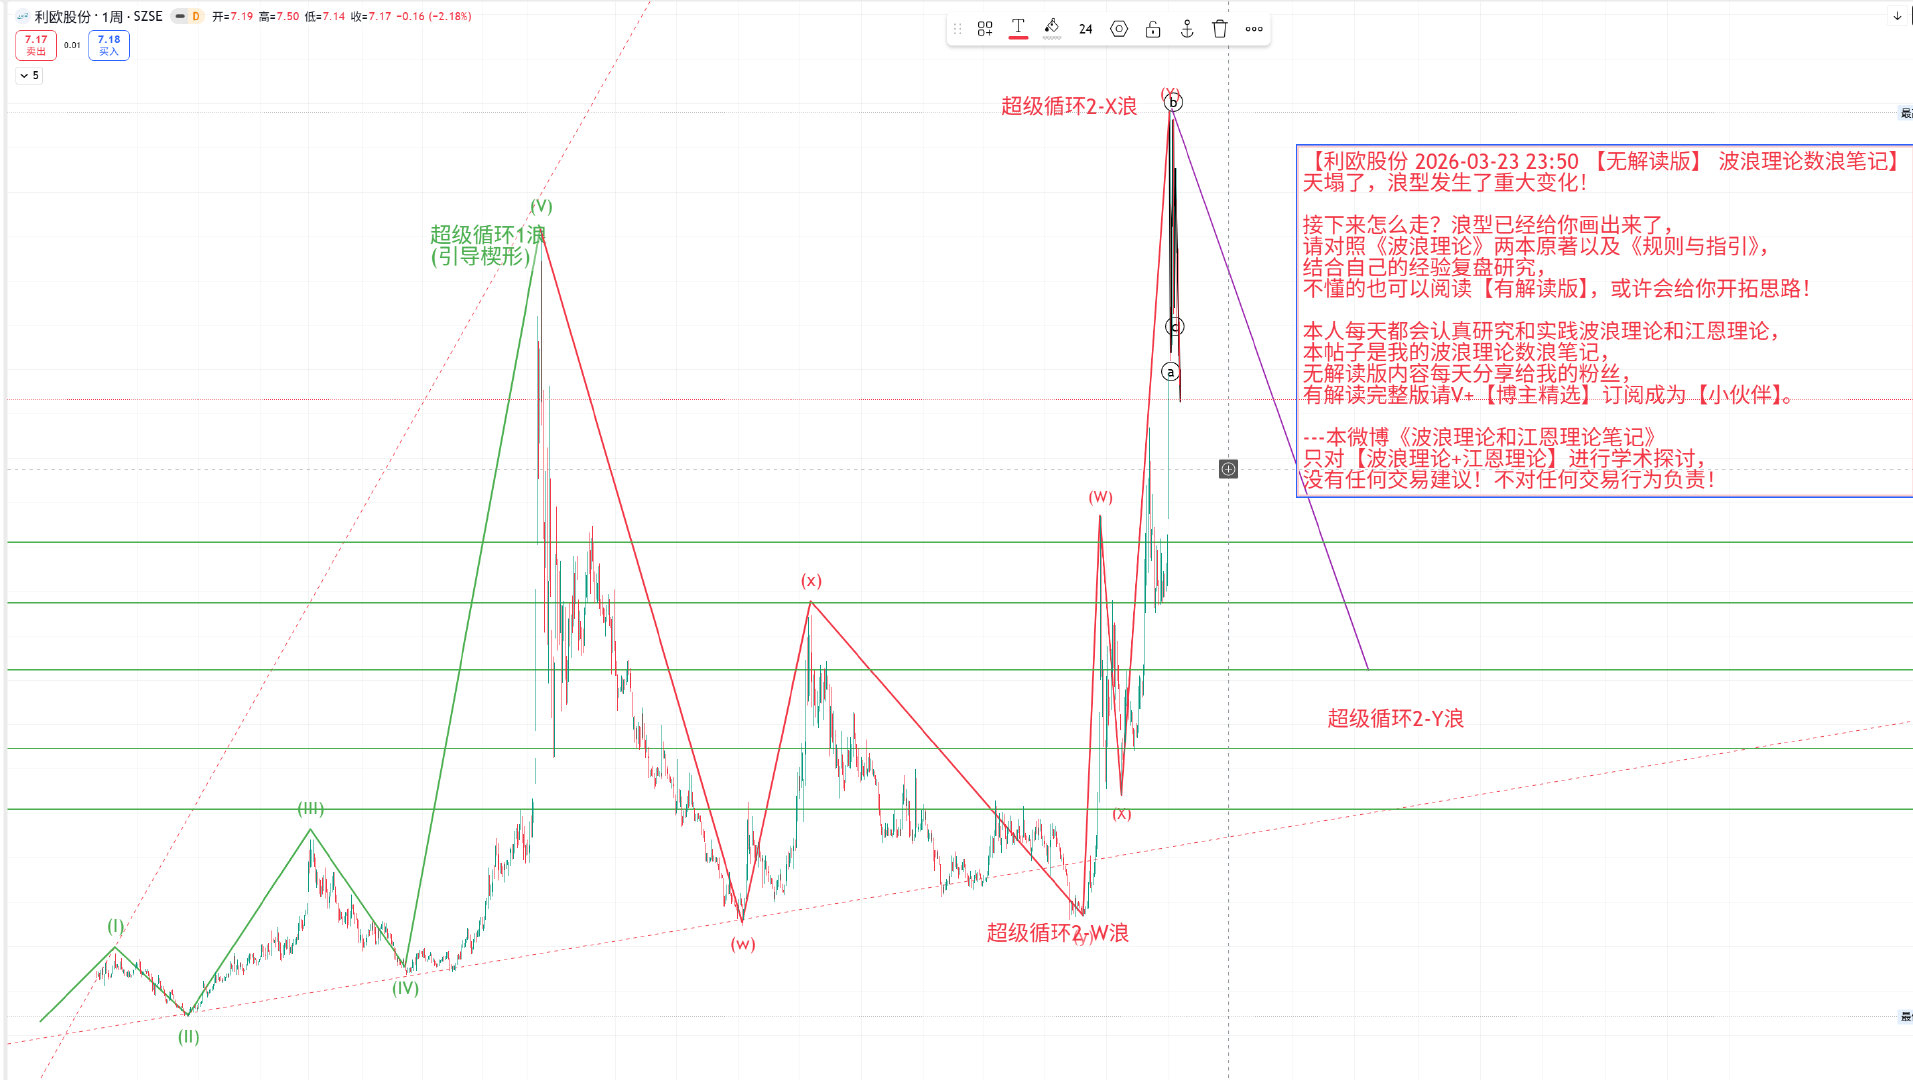
Twelve, learning notes on Liuo shares
The wave pattern has undergone significant changes; be careful!
From now on, the subsequent wave theory notes on [Liuo shares] with [interpretative version] will require you to study the wave theory on your own.
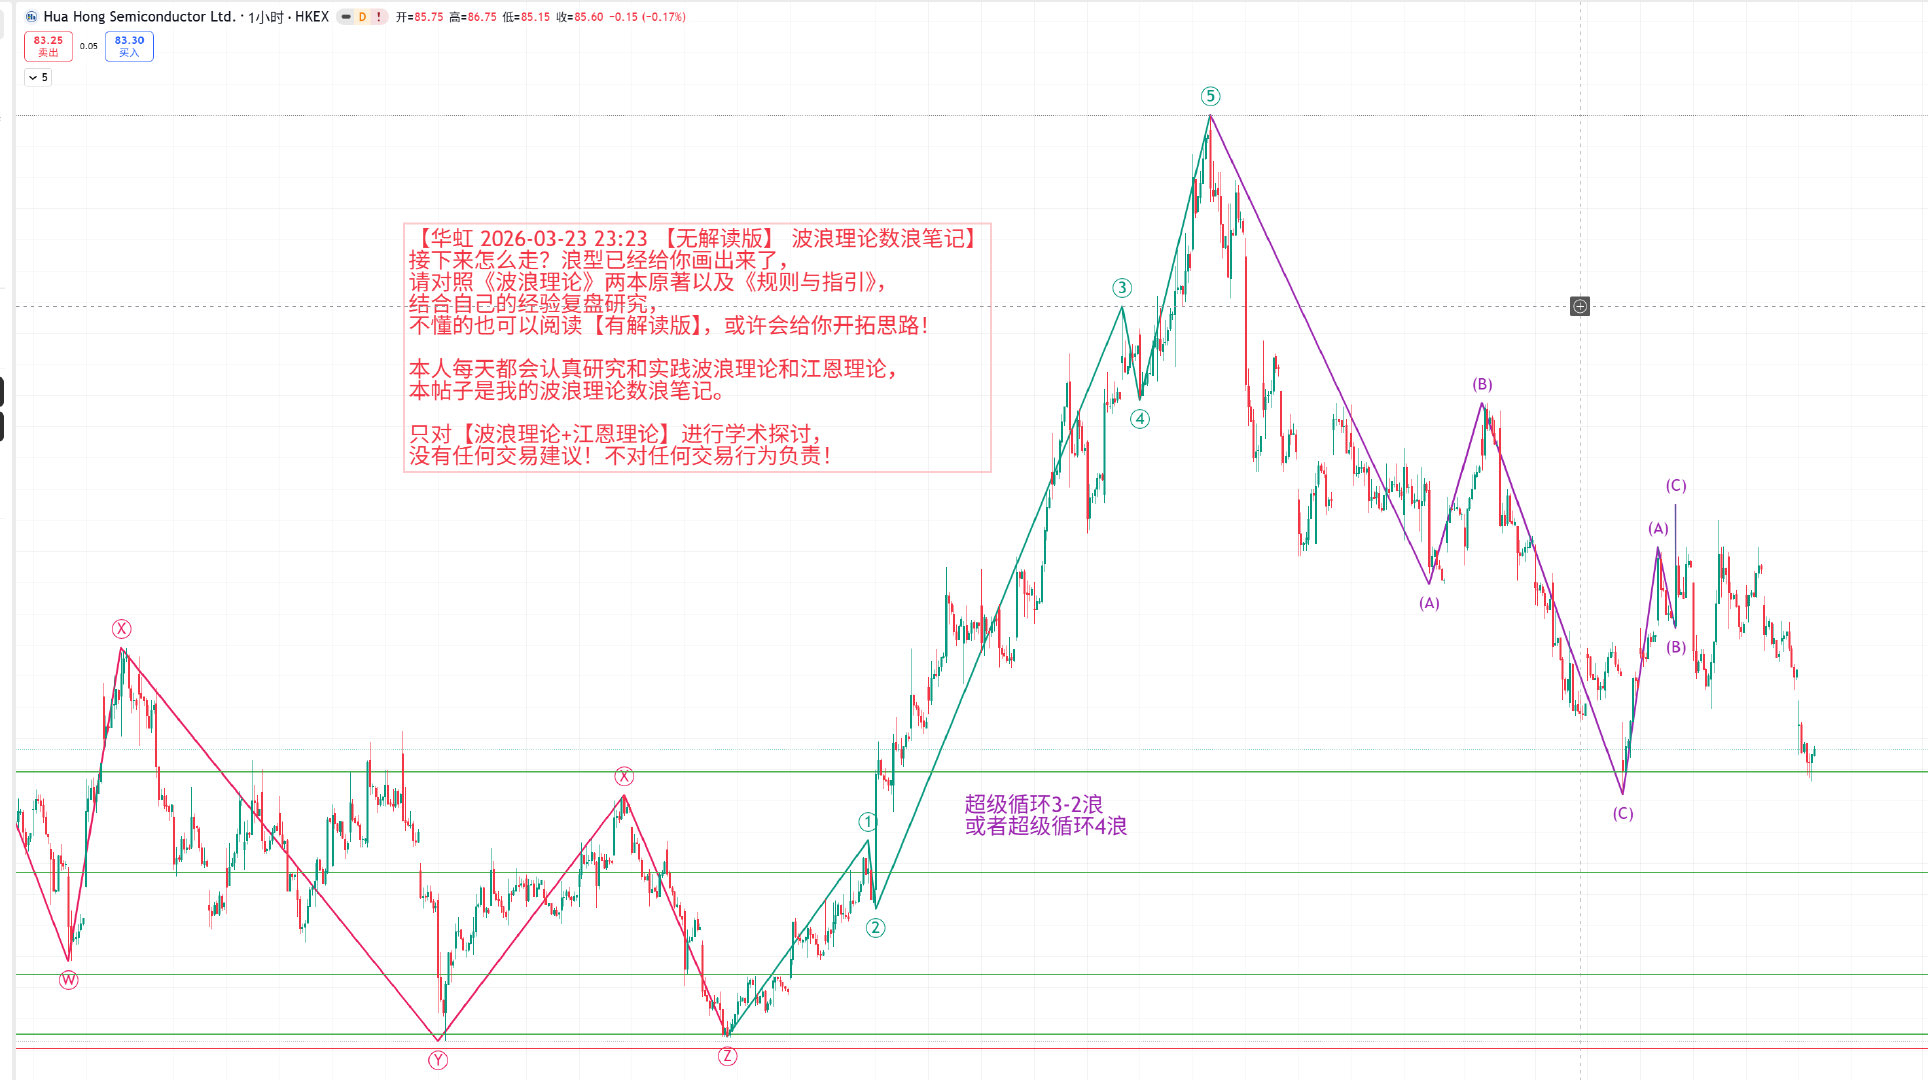
Thirteen, learning notes on Huahong Semiconductor
The week before last, I predicted a rebound in the range of 75.4-81.85, with the lowest starting rebound at 80.4; once again, my prediction was correct.
Last week I predicted the rebound resistance level of 97.05-102.2 after which it would continue to fall; once again my prediction was correct.
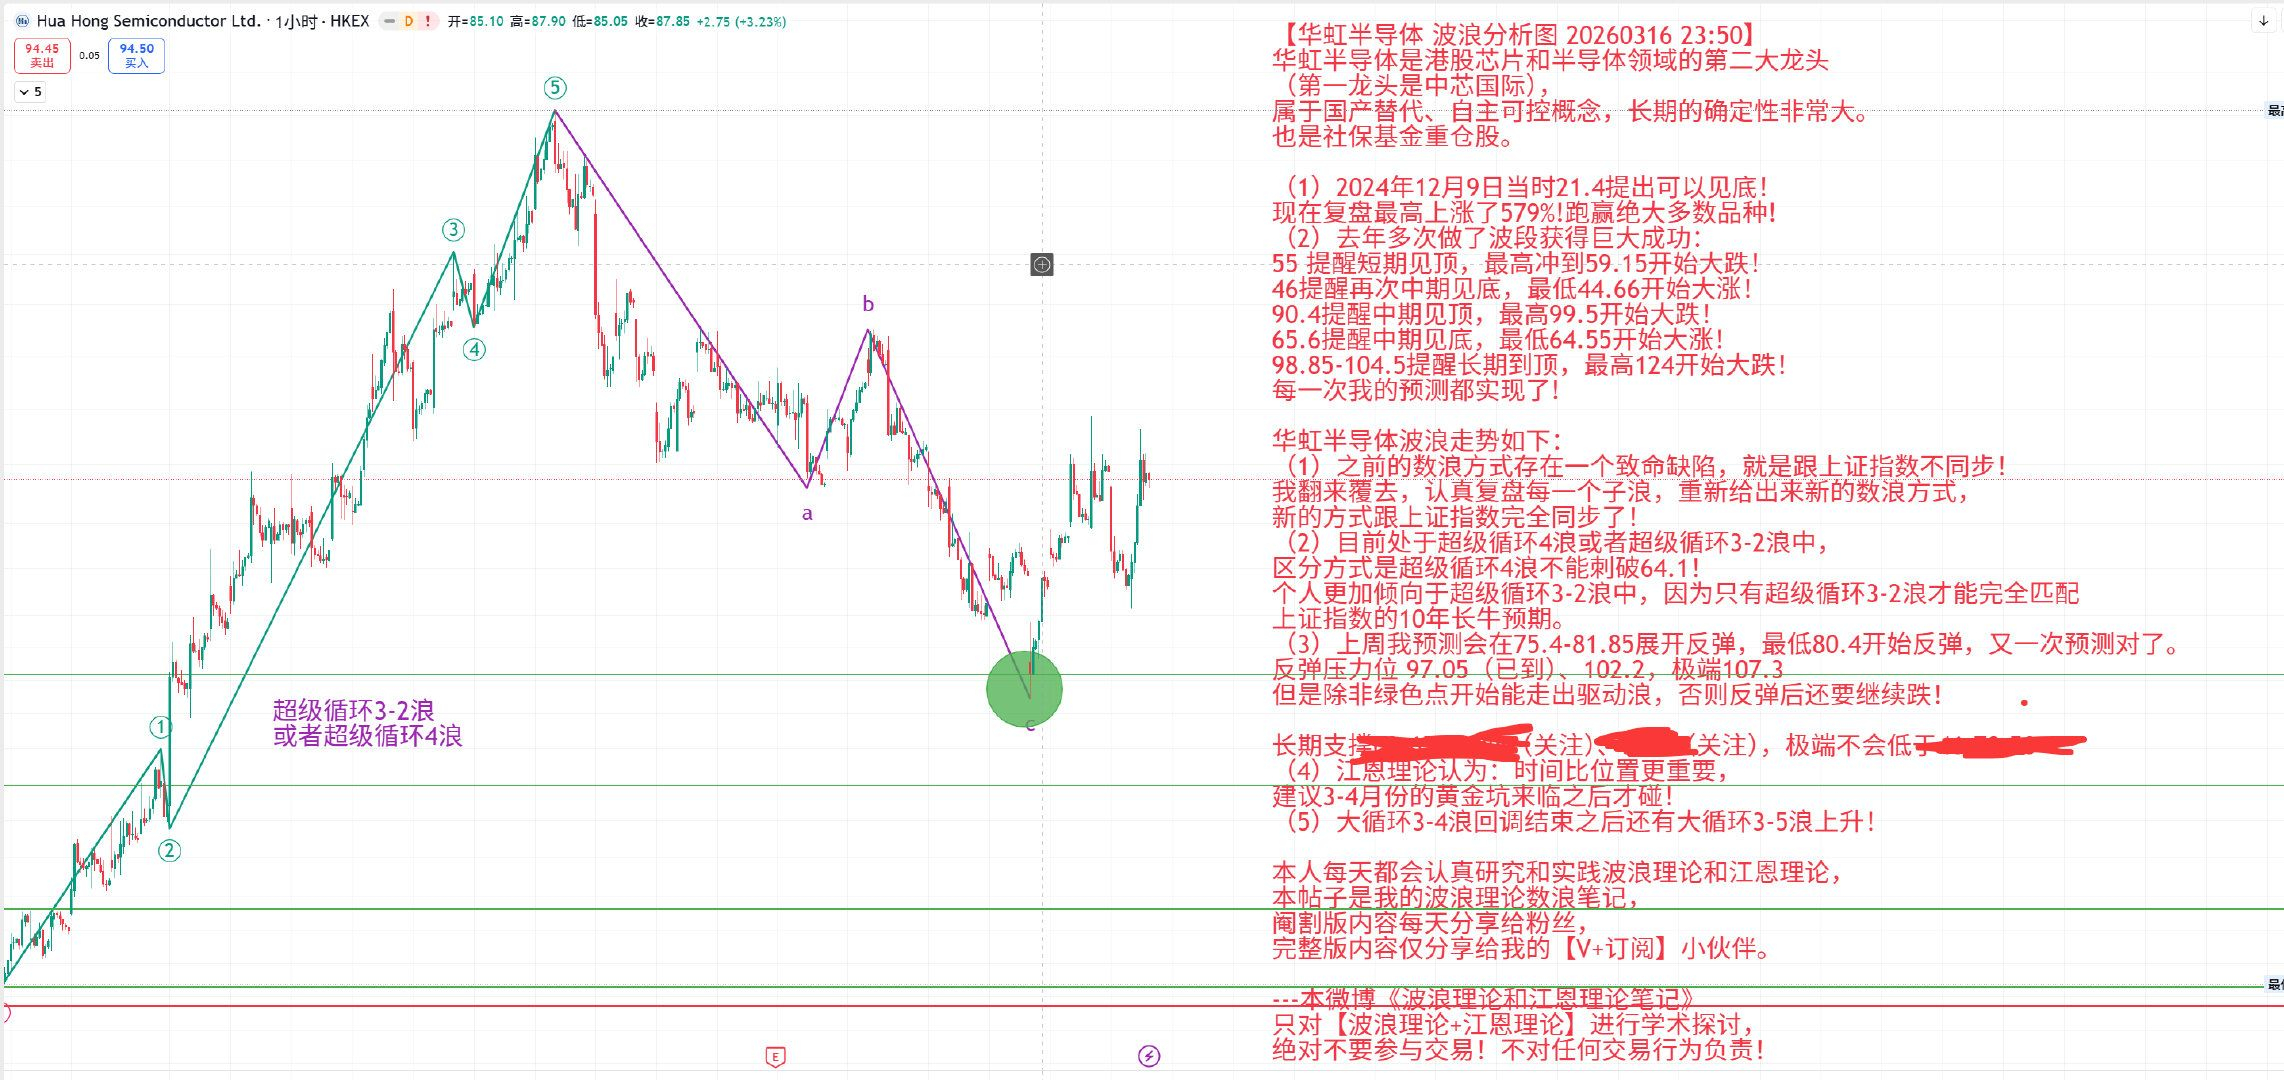
From now on, the subsequent wave theory notes on [Huahong Semiconductor] with [interpretative version] will require you to study the wave theory on your own.
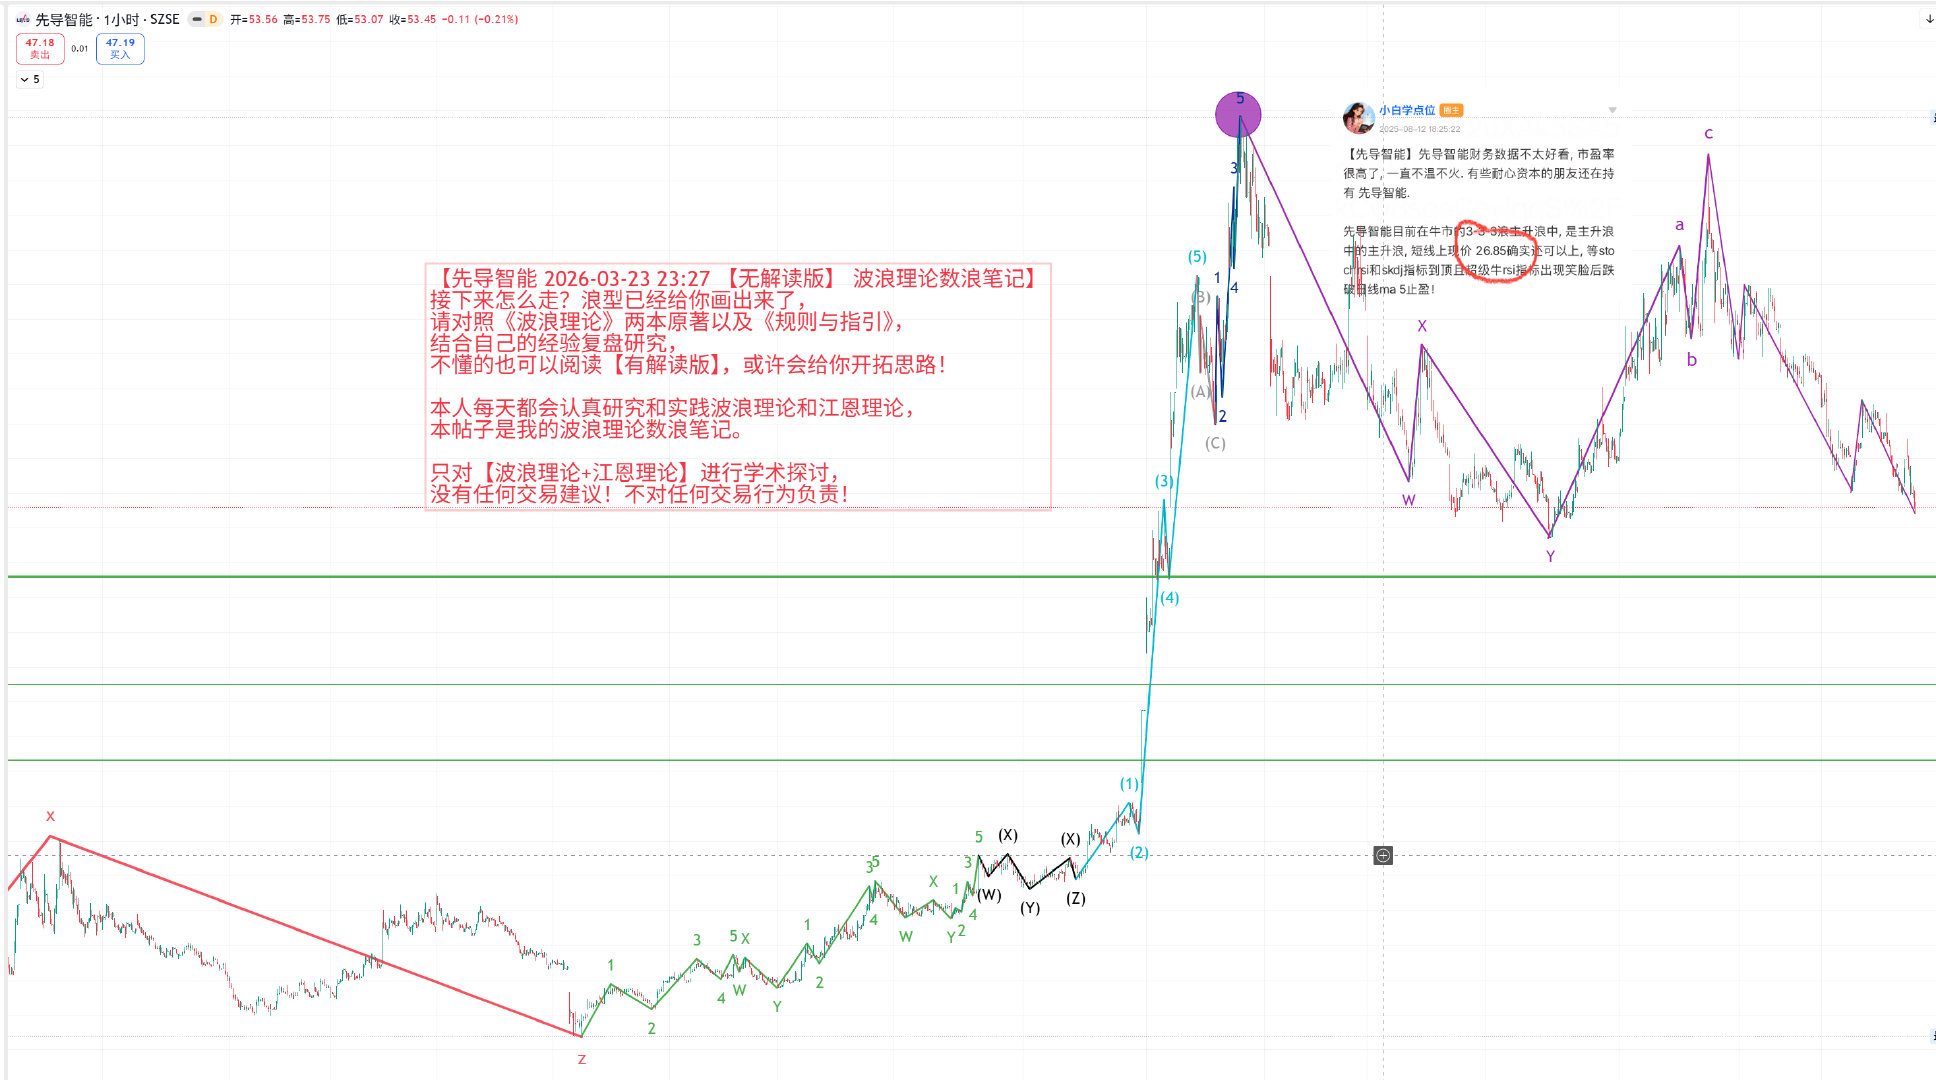
Fourteen, learning notes on leading intelligence
Last week I predicted the rebound resistance level near 53.94, and it would continue to fall after that; once again my prediction was correct.
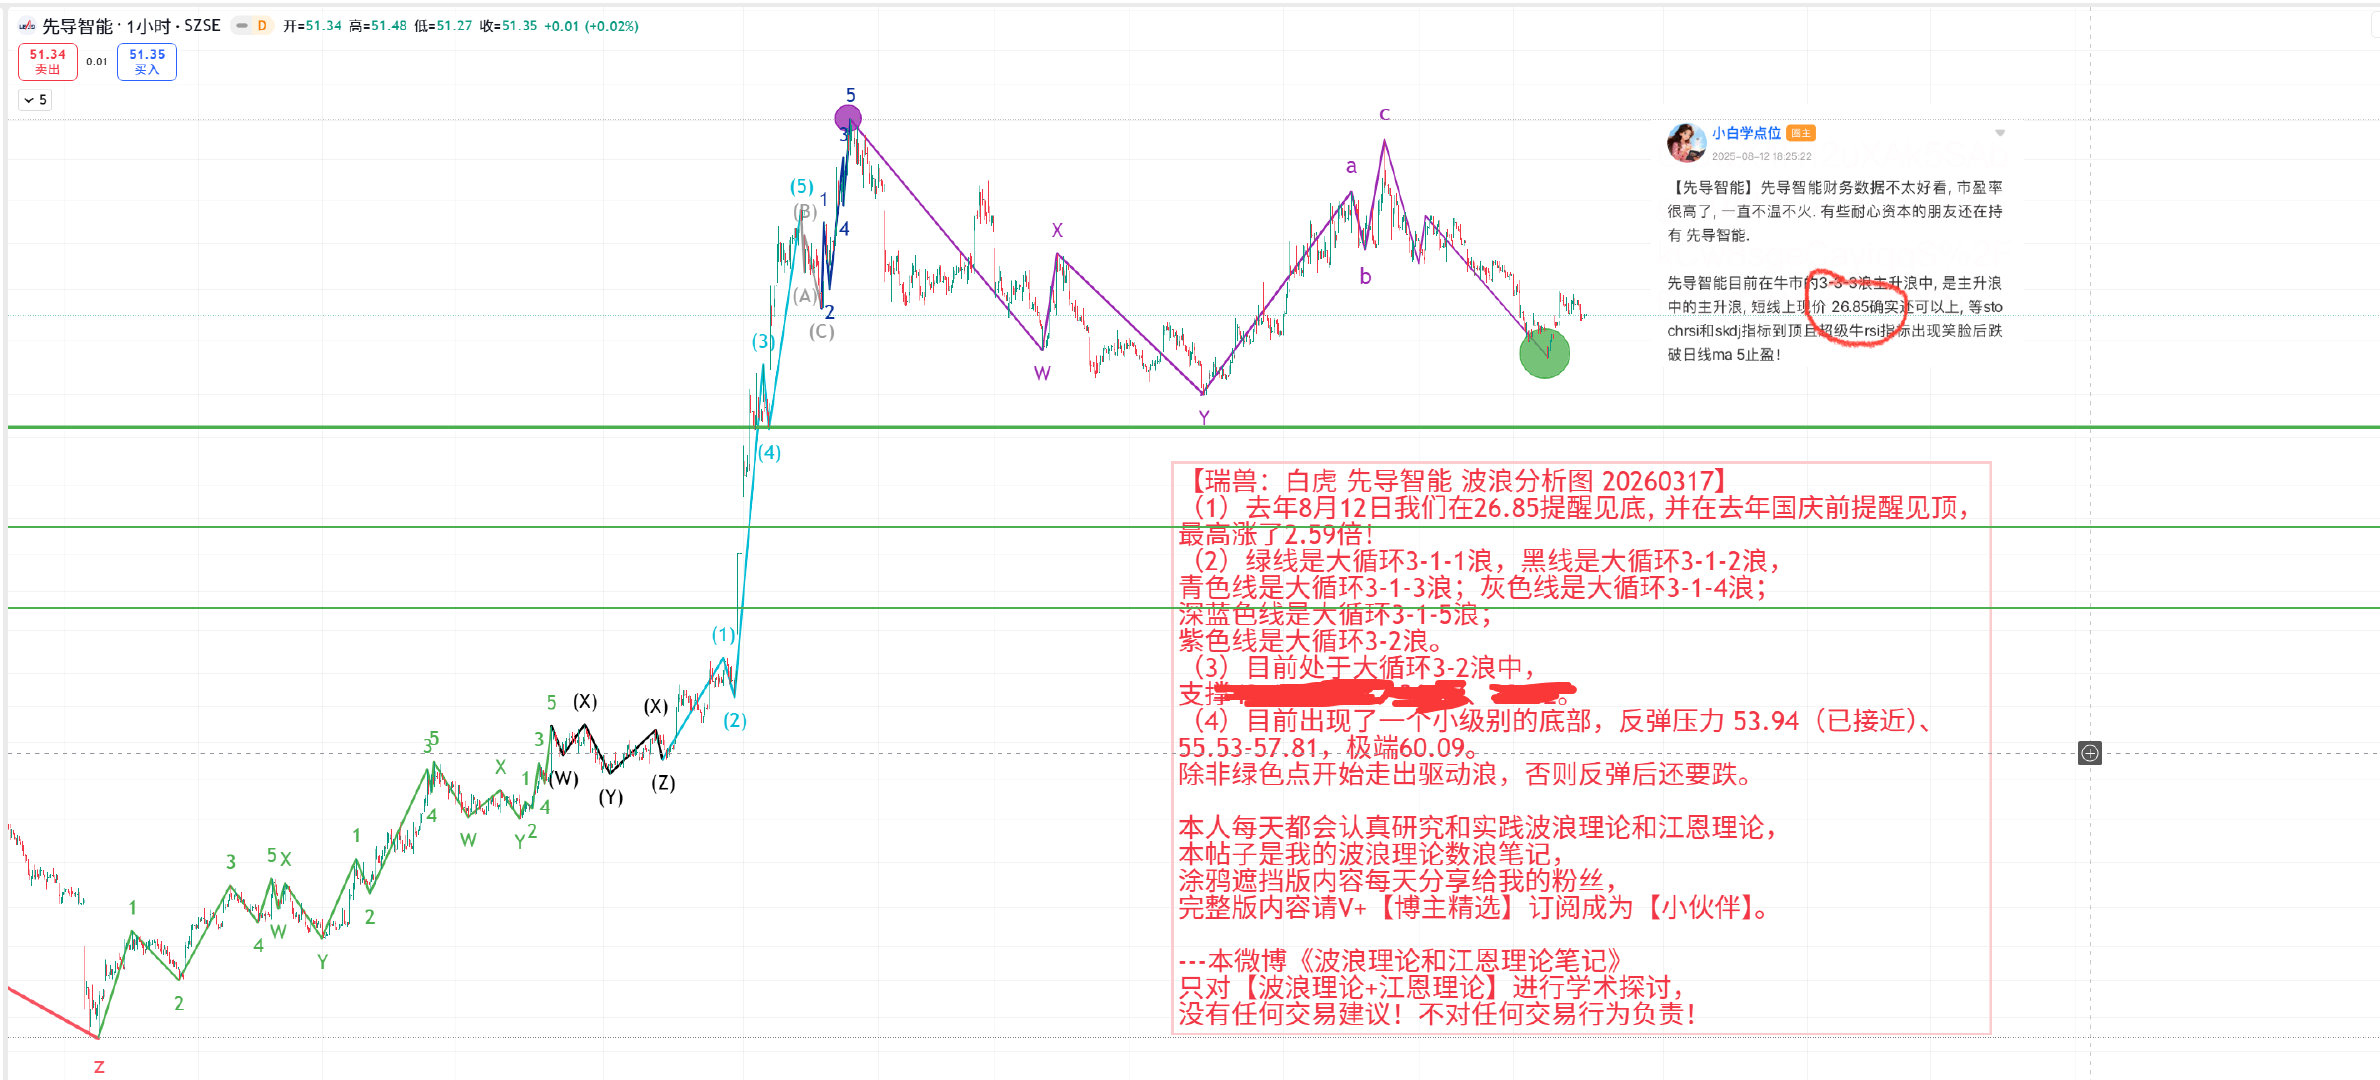
From now on, the subsequent wave theory notes on [leading intelligence] with [interpretative version] will require you to study the wave theory on your own.
Fifteen, to forge iron, one needs to be strong oneself
To forge iron, one needs to be strong oneself; we emphasize the sharing of knowledge and the cultivation of independent thinking. We welcome those who share our values and are willing to learn and cultivate independent thinking skills; only when you turn this knowledge and skills into your own accumulation can you have the ability to think independently and avoid becoming a speculator!
Creating articles is not easy; reading an article takes only a few minutes, but writing an article takes several hours. Every bit of support from you is the motivation for my creation; I see every bit of love from you! ❤️ Thank you all ❤️!
👉 ✅ Like ❤️, ✅ Follow ⭐, ✅ Comment 💬 ✅ Share 📤 every interaction is a two-way journey! Come to the comment section to interact with me and become better together~