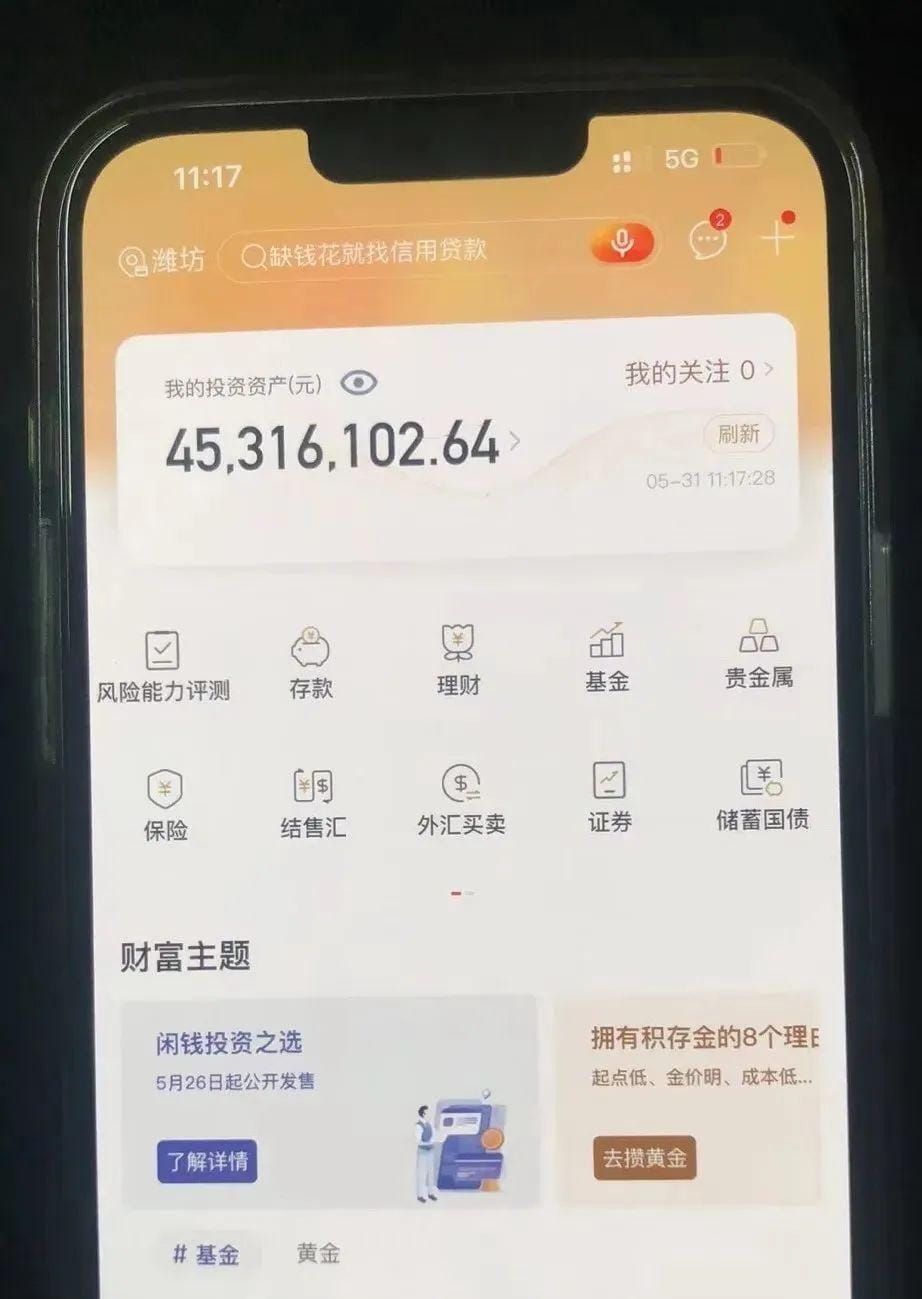
As the old saying goes, 'No one becomes rich without unexpected wealth, and no horse grows fat without night grass.' I believe many people enter the cryptocurrency world with the initial intention of making a big profit and then reaching the peak of life. However, due to a lack of the right methods, things often go awry, and in the end, they lose both their money and their soldiers.
Thus, many people begin their learning journey, such as buying books, researching information, or seeking guidance from experienced individuals, etc.
What kind of people in the cryptocurrency world can really play with Bitcoin? There are only two types of people: those with vision and those with insight.
(1) People with vision can grasp the overall direction of the future, while those with insight can seize current opportunities. In fact, this can be quite responsible.
Let me tell you: you can only rely on your continuous trial and error, suffering losses, and then taking various detours to get here.
(2) There are many ways to make money in the cryptocurrency circle; some may not agree, but indeed some people can make money. You just didn't notice.
His growth is exactly the same as yours; without the solid foundation laid in the previous years, there would be no subsequent explosive period.
Any success is certainly not accidental.
(3) If you want to achieve stable profits, you must go through several years of bottleneck periods, half a year learning techniques, one year practicing execution, and one and a half years practicing mentality.
In the bottleneck period, what matters most is to minimize losses. If you're willing to spend time, energy, and summarize, and have a good mentor,
With friends accompanying, the career in the cryptocurrency circle becomes much simpler.
Thinking about my years in the cryptocurrency circle, going from an ordinary small trader to a professional making a living from trading, it is inseparable from strictly adhering to market discipline.
Today I summarized 10 'cryptocurrency trading rules,' each one is valuable.
If you want to survive in the market for a long time, I suggest you bookmark this article, think about it repeatedly, understand these 10 rules of trading cryptocurrencies, and easily earn millions a year.
The market's emotions accumulate and are guided this way. If you can't escape this state, you will never become a true market participant.
These are my heartfelt words after many years of trading cryptocurrencies; each one is very useful.
But the hardest part is achieving the integration of knowledge and action. I hope everyone can remember these iron rules and together sail through the cryptocurrency circle! Sail through the cryptocurrency circle!
Killer skill! Please pay attention to these 8 price action chart patterns; the opportunity to double your profit lies within them.
Price Action chart patterns can be said to be a major trading tool for modern traders. Today, Aze will mainly introduce 8 price action chart patterns, which have indeed had a significant impact on my trading.
Next, I will guide everyone to understand 'BOSS' and 'BEAR' and more other price action chart patterns.
Price Action Pattern #1: Bullish Engulfing Strong Support (BOSS)
It appears as a bullish engulfing (Bullish Engulfing) candlestick pattern at a strong support level.
The most important thing here is not the exact candlestick pattern, but the position it appears in. Ideally, it should be right at or slightly below the support level.
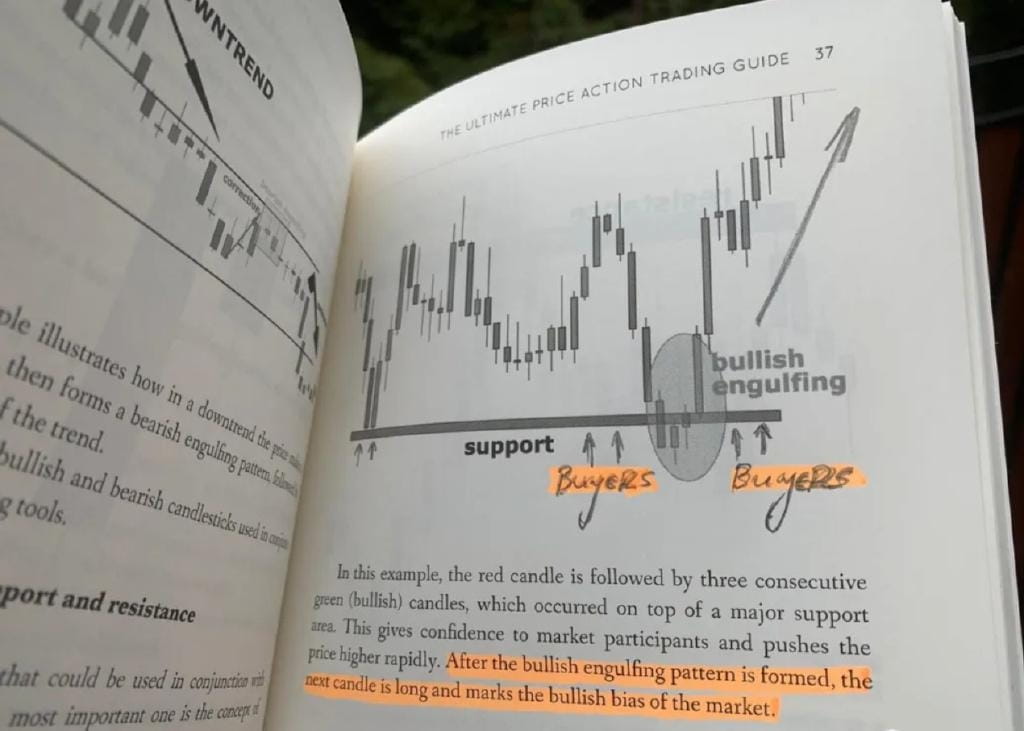
As the name suggests, the BOSS pattern is one of the best price action patterns.
The above chart is one of the best charts describing this pattern from a book on price action.
From the above chart, it can be seen that after the formation of the BOSS price action chart pattern, the price rose significantly.
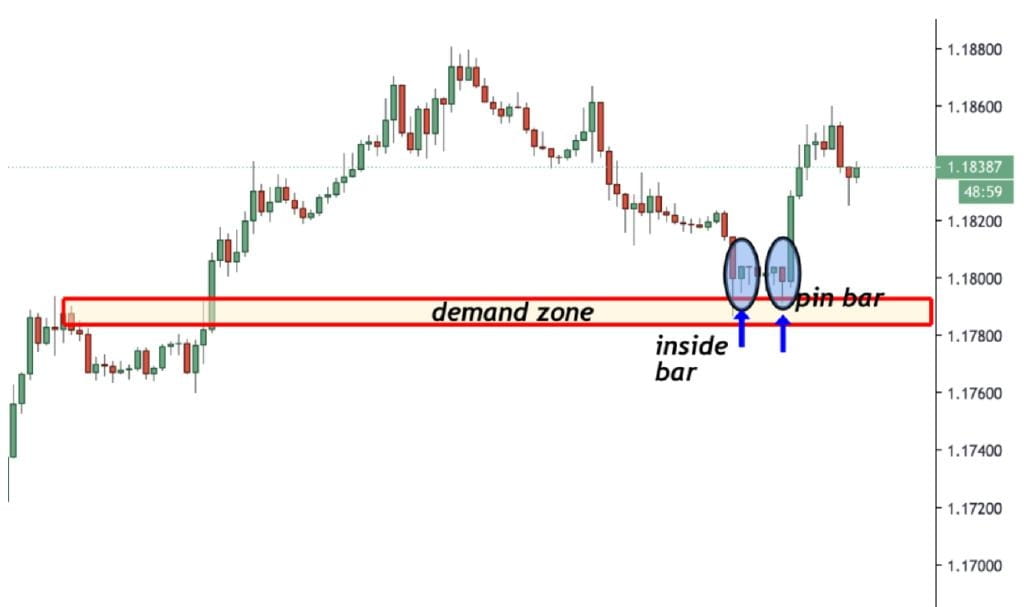
There are many such cases, the most recent one being the BOSS price action chart pattern of EUR/USD:
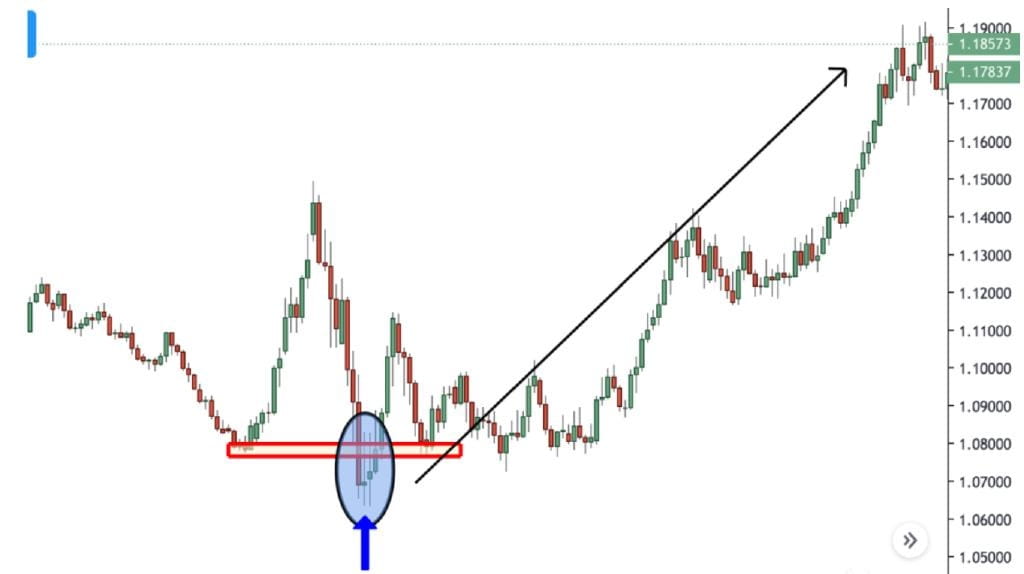
The above chart has a major demand area/support level, when the price tests it, an inside bar will form, attracting a large number of market participants.
One of the reasons I call this pattern a strong support bullish engulfing is that any candlestick pattern can be a triggering factor.
Price Action Pattern #2: Bearish Engulfing Strong Resistance (BEAR)
This price action chart pattern indicates that the price needs to test strong resistance levels or supply areas.
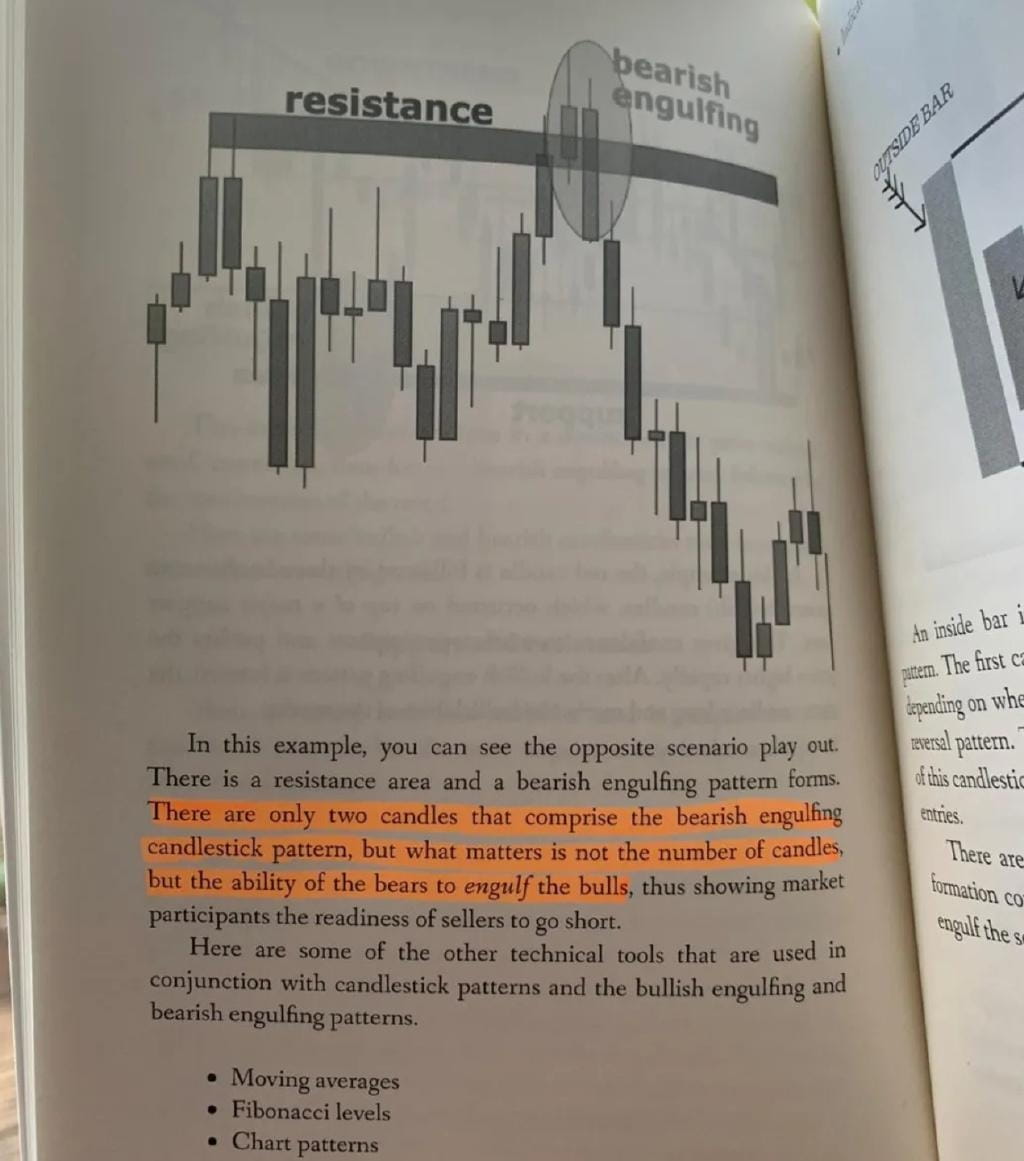
The above chart is also taken from (Price Action Trading Manual).
I find that for this price action pattern, the bearish engulfing (Bearish Engulfing) may be the best candlestick pattern.
However, from a long-term perspective, this kind of chart pattern will continue to appear.
This is an example of a GBP/USD daily chart from 2018:
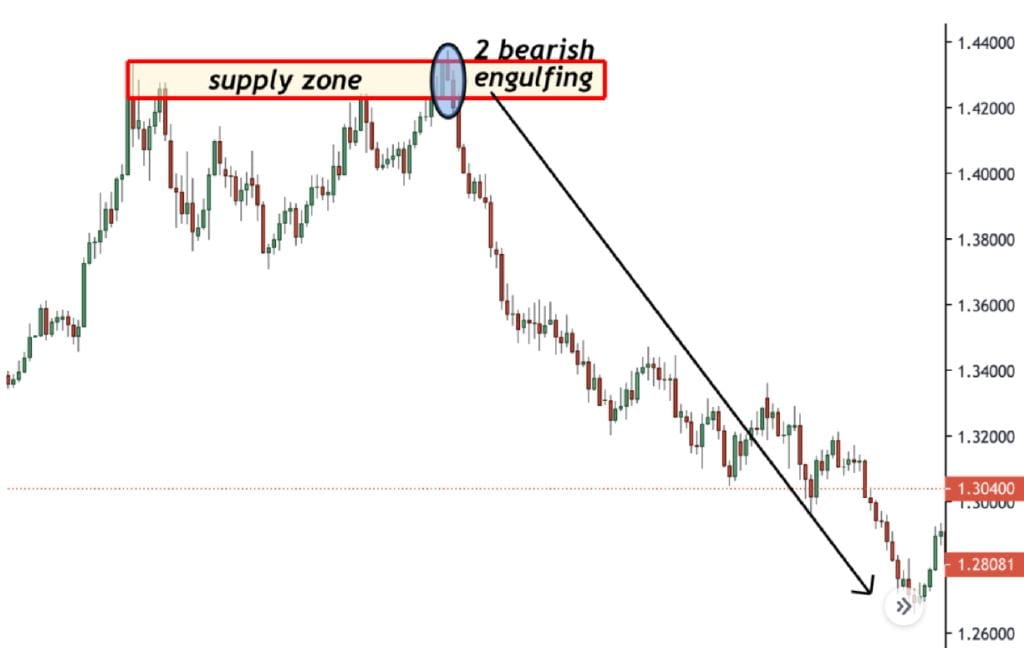
From the above chart, it can be seen that this double candlestick pattern exhibits a very strong trend reversal effect.
Engulfing patterns can consist of multiple candlestick bodies. Importantly, the bearish candle (red) completely covers the previous bullish candle (green) body.
This indicates that bears are ready to push the price in another direction for a long time.
The BEAR price action chart pattern is considered one of the best bearish price action chart patterns in my trading career.
Price Action Pattern #3: Inside Bar in Trend (IBWT)
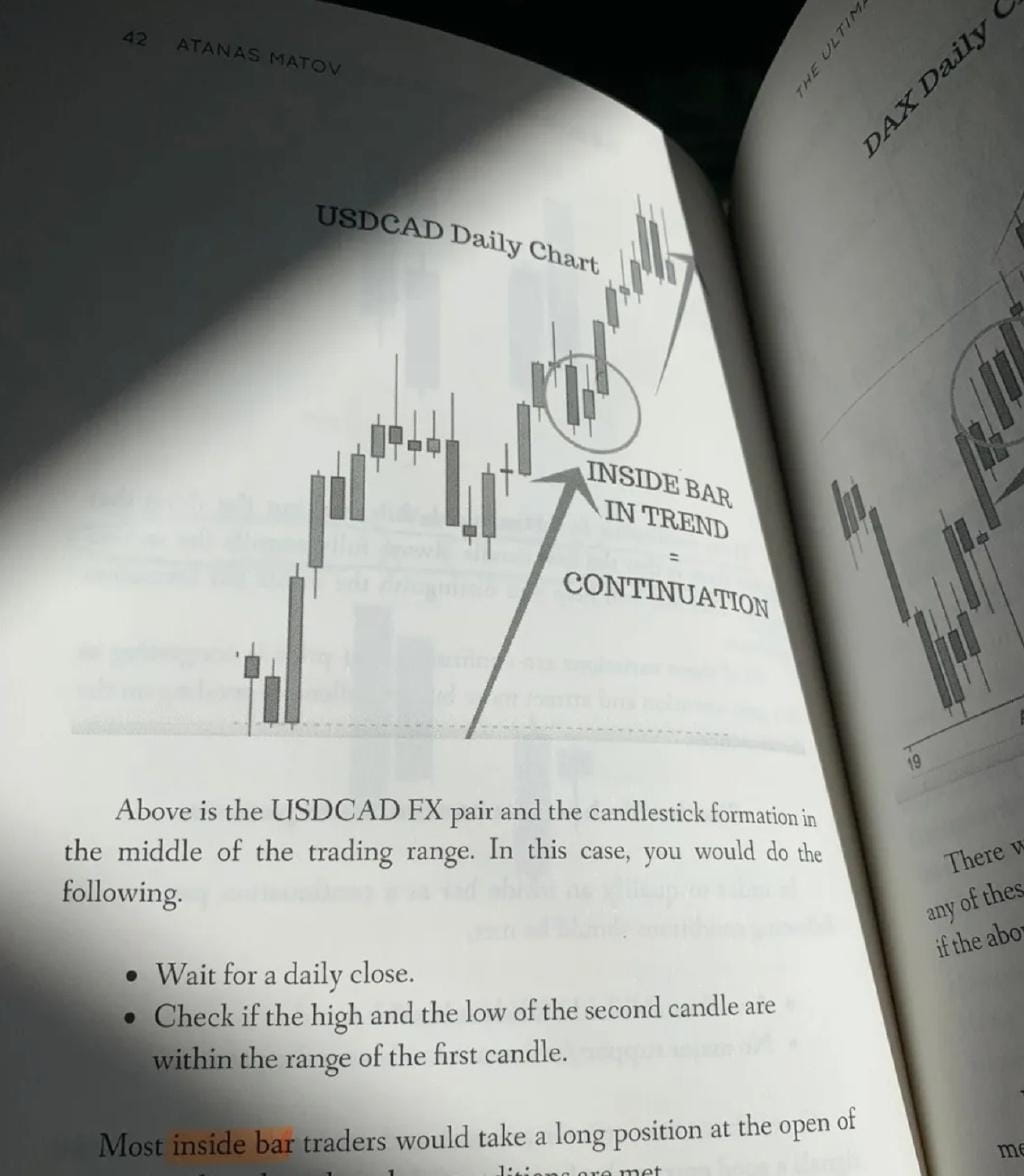
The IBWT price action pattern is one of my favorite candlestick patterns for two main reasons:
1. High reliability
2. Provides a high risk-reward ratio
From the perspective of trading returns, this may be the highest price action chart pattern.
Let's see why I say this.
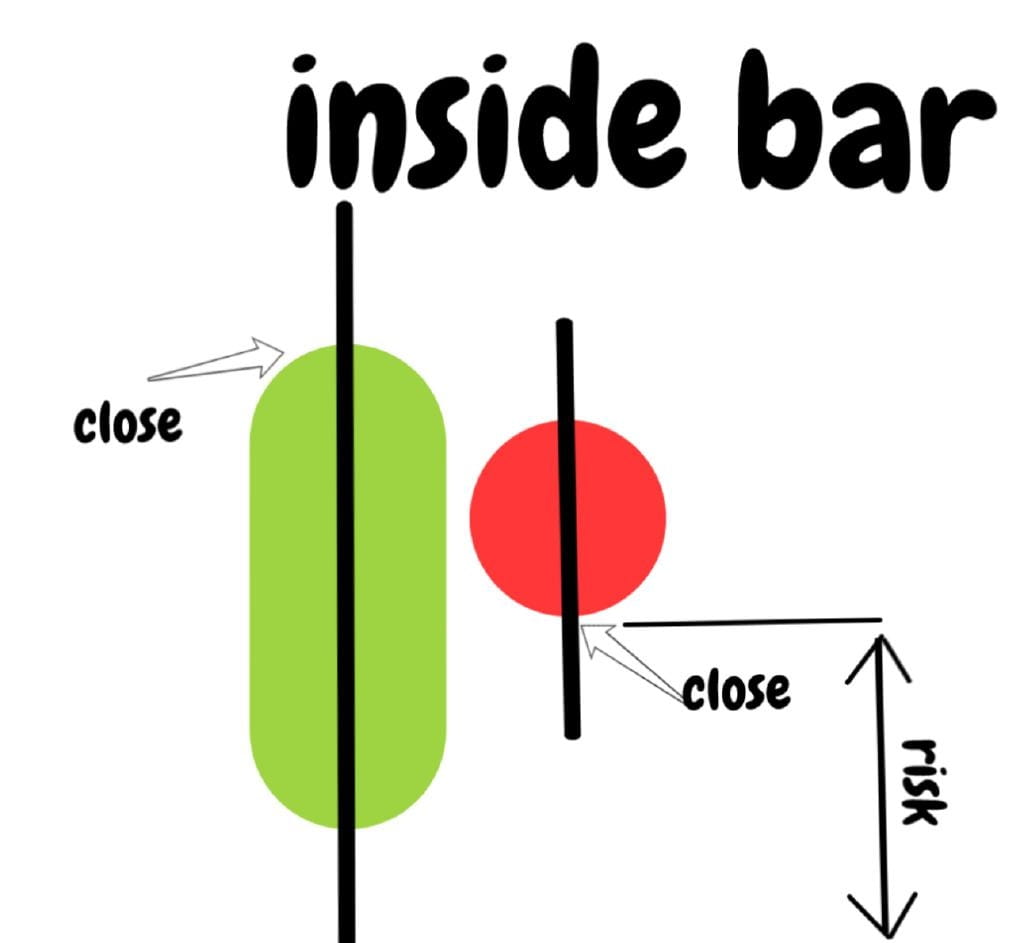
Looking at the above chart, the reason this candlestick pattern has such a high risk-reward ratio is that the closing price of the red candlestick is very close to the low of the green candlestick.
This allows for setting stricter stop losses, hence a higher risk-reward ratio. In other words, it means you can risk less money to earn more profit.
The following chart is another example of an inside bar in the Daily DAX chart:
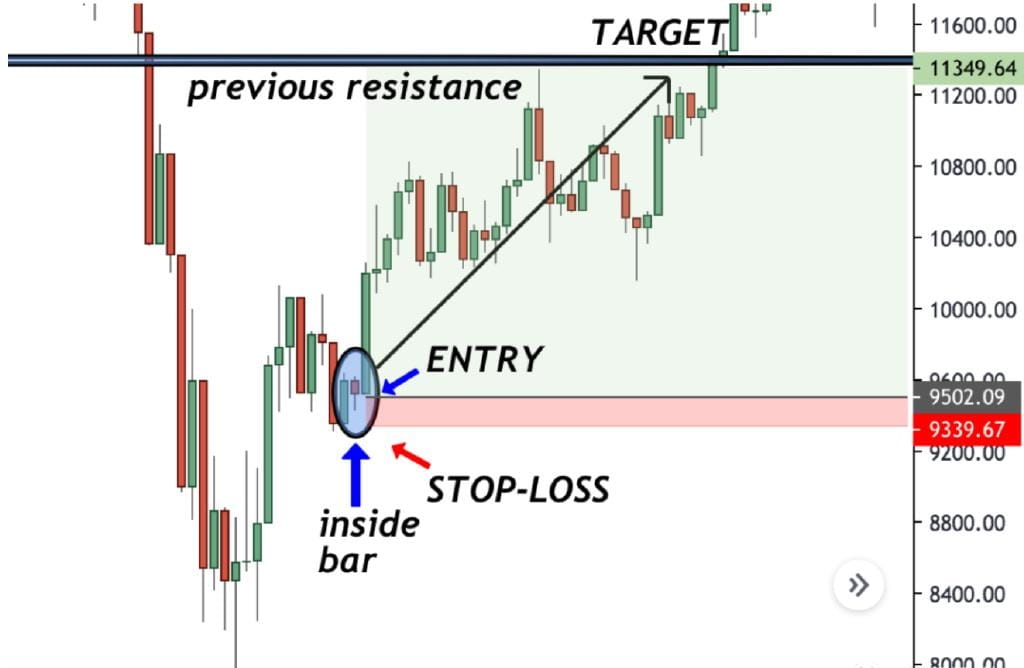
You can see from the above chart that the inside bar allows you to use a very small stop loss to 'aim for' a larger return. The risk-reward ratio in the above chart is almost 1:12.
This means that if your entry point is 9502 and your stop loss is 9339, you are risking 163 points, but if your take profit target is 11349, it means this trade has a potential return of 1847 points in profit.
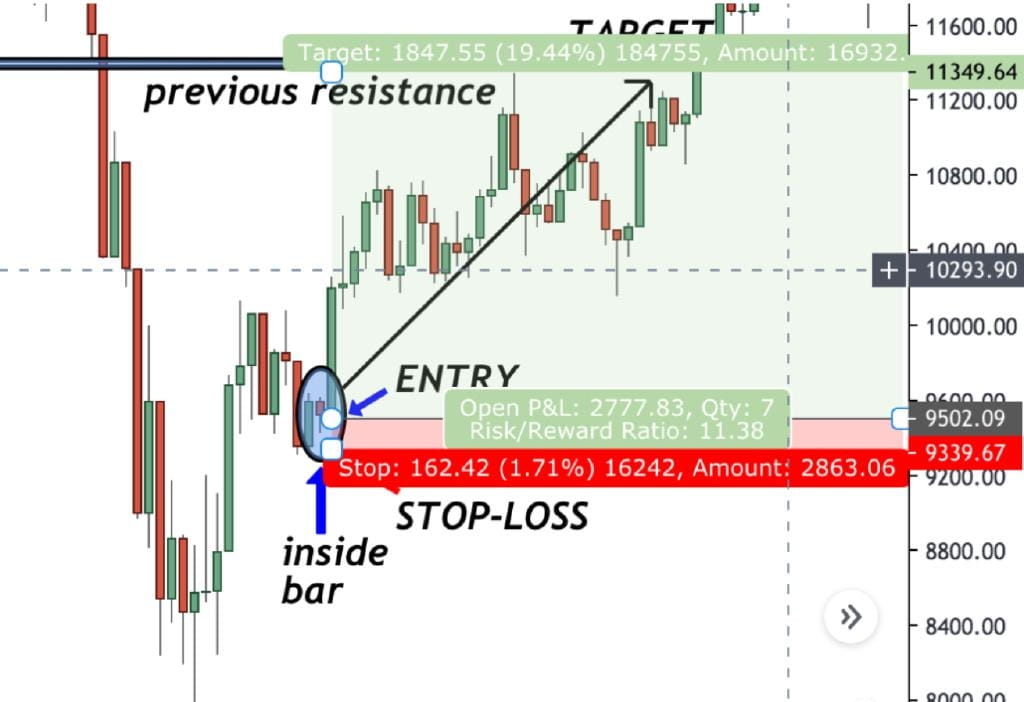
I must say, this is a very nice trade with a risk-reward ratio of 11.38.
Price Action Pattern #4: Pin Bar in Supply Area (SUP)
The SUP chart pattern is one of the most effective bearish continuation patterns. We need the following two conditions to confirm the appearance of this pattern:
1. Major/Minor Supply Area/Resistance Level
2. Price rebound price action pattern
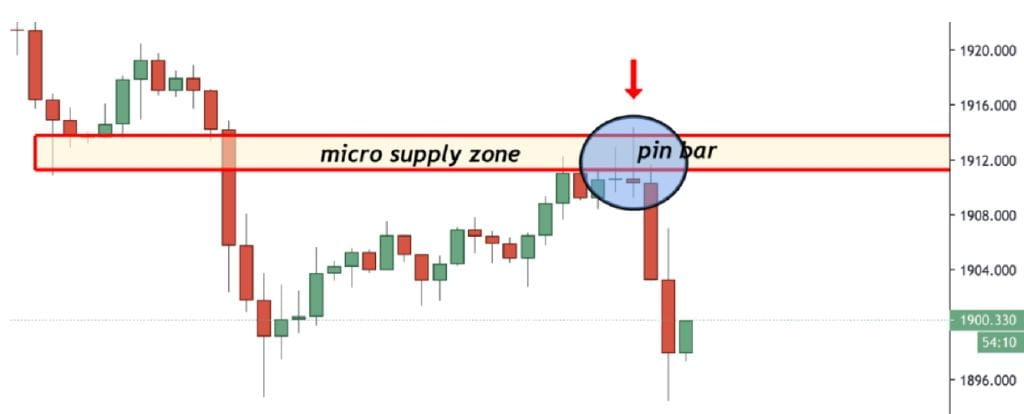
The above chart is a 1-hour gold chart from October 23, 2020. We can see that the pin bar in the chart encountered resistance and fell back at the important level of $1912.
Once the price rises to the pivot level, a price rejection may occur, followed by a sudden drop in price.
At this time, you need to decisively enter the market to seize these trading opportunities.
As you can see, after the pin bar encounters resistance, the next candlestick will be a very long bearish candlestick.
Price Action Pattern #5: Random Resistance Rejection (RRR)
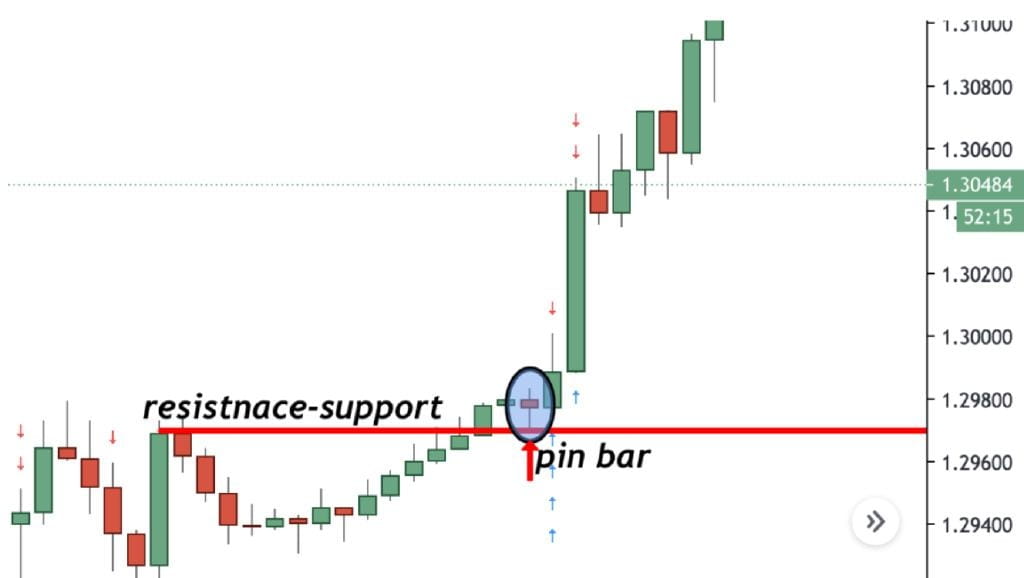
The above chart is a GBP/USD 1-hour chart. It shows a price action chart pattern called RRR (Random Resistance Rejection).
The reason it is called 'random' is that it can happen at any point in time, as well as during important 'event convergence zones'.
Like previous price action patterns, RRR appears within different time frame charts.
A rule of thumb tells us: 'The higher the time frame, the more precise the signals.'
In this case, we observe a resistance level turning into a support level, and a pin bar forming a bounce from that level.
Coincidentally, the candlestick on the daily chart is an inside bar.
This is a very good example of high-probability trading.
However, it is important to note not to confuse this pattern with a breakout.
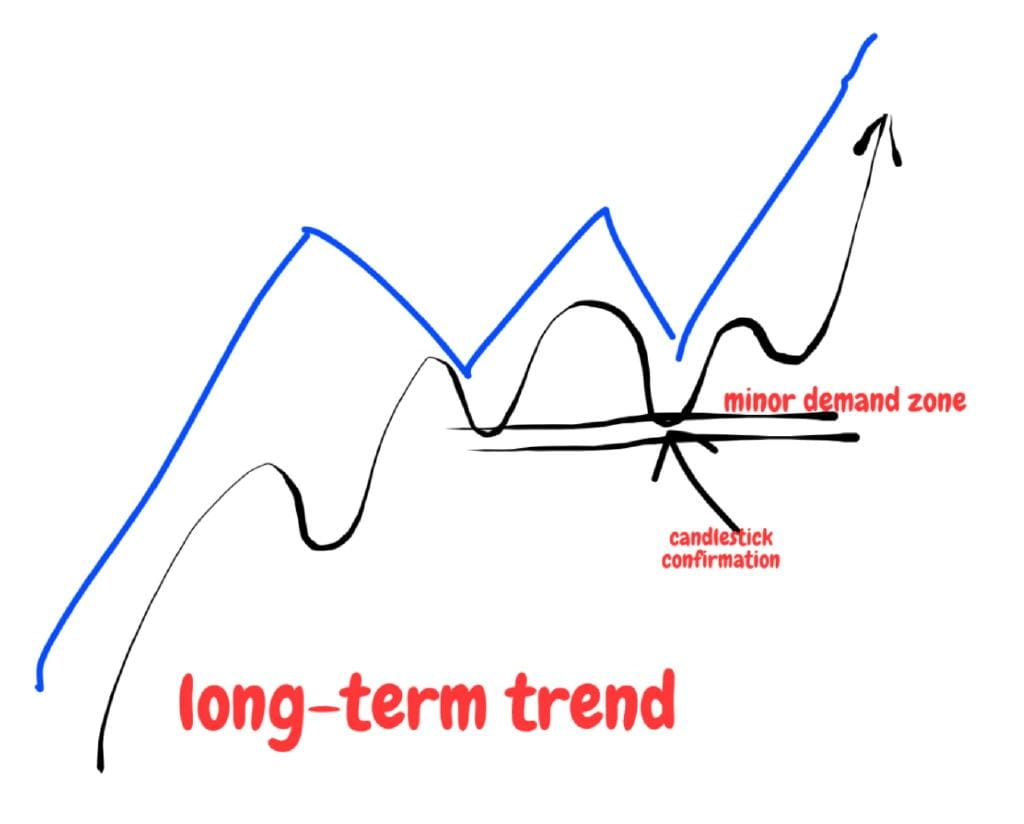
Price Action Pattern #6: Demand Area Candlestick (DZC)
The above chart is a price action chart pattern obtained in the EUR/USD hourly chart, specifically the demand area candlestick pattern.
To verify this price action pattern, we need to follow two important rules:
1. Secondary demand area 2. Candlestick confirmation
This chart pattern is very similar to the bullish strong support (BOSS).
The only major difference is that it usually appears in secondary demand areas rather than primary demand areas. See the chart below:
Those who are familiar with me should know that in trading, I try to stay away from diagonal trendlines or channels.
Here, I am just showing a classic example.
Once a secondary demand area is detected, we can mark it on the chart and lie in wait near the price.
When the price is 'trapped' in the demand area, what we need to do is use price action for confirmation and then look for opportunities to enter trades.
This may be one of the most powerful trend continuation techniques, and it can also be used to implement strict stop losses.
Price Action Pattern #7: Theory and Reality (TVR)
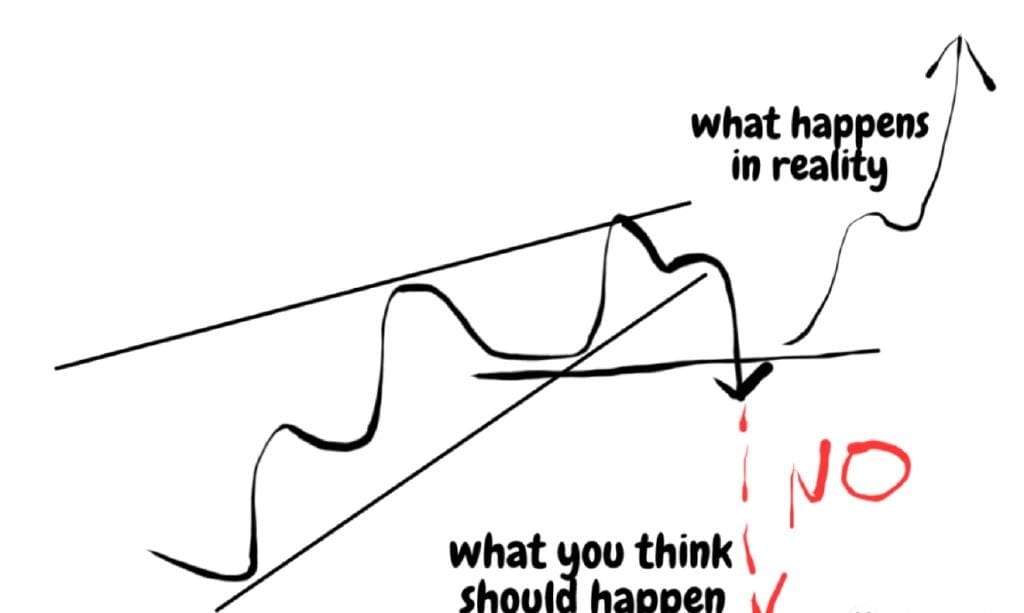
Chart patterns that cannot operate as expected or theoretically with reality.
Many traders blindly follow the converging triangle pattern, but in reality, they are not as precise as people imagine.
One of the advantages of the converging triangle is that it is easy to discover.
The problem with this trading setup lies here, as it is easy to be noticed, so many traders will try to profit from it.
You should know that trading is a zero-sum game; it does not allow such behavior. Blindly chasing highs turns traders into victims.
One of the problems with the TVR price action pattern is shown in the following chart:
When you discover this triangle pattern, most traders will expect the price to break up.
However, contrary to expectations, the price moves in the opposite direction.
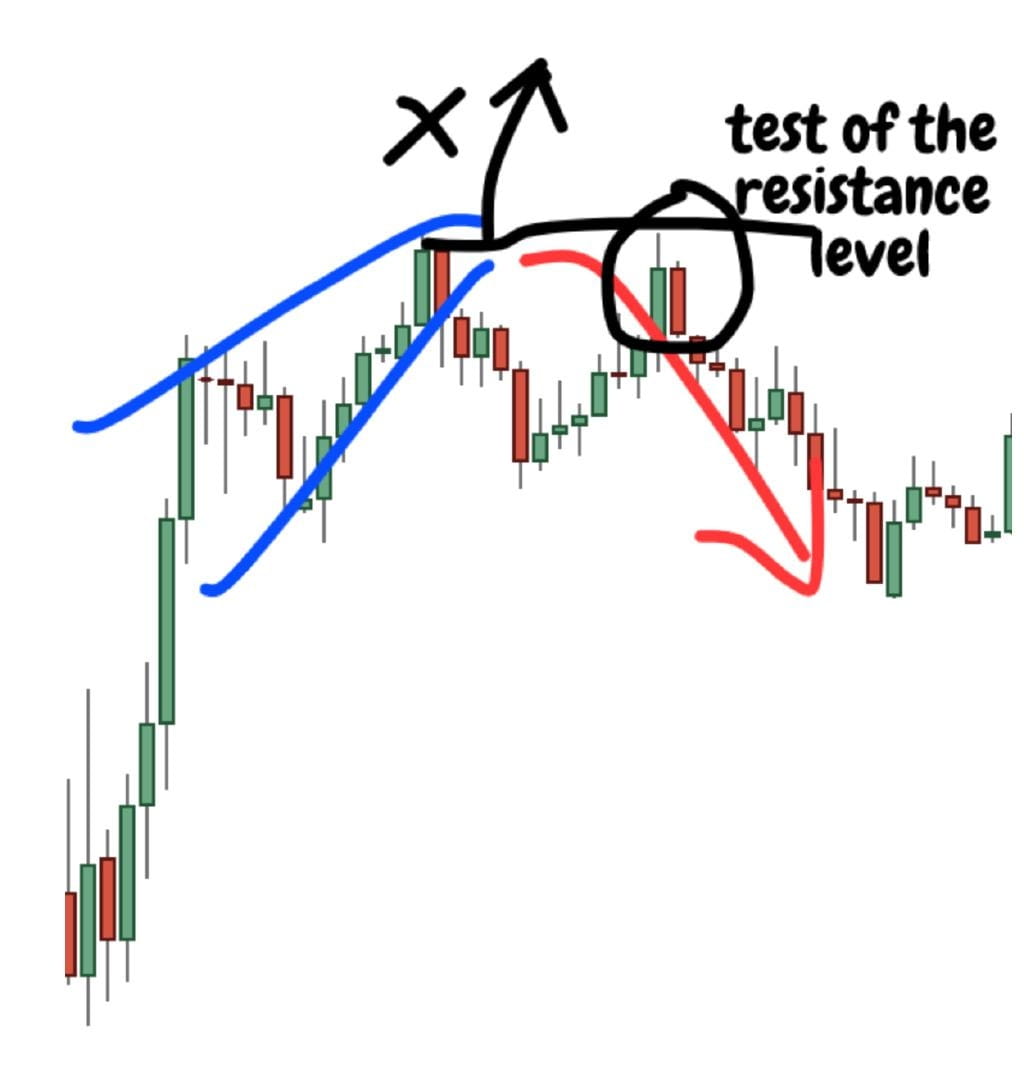
The reason we did not see an upward breakout is that the price was not able to withstand the test of the resistance level and began to turn down.
Before starting to decline, pay attention to the inside bar.
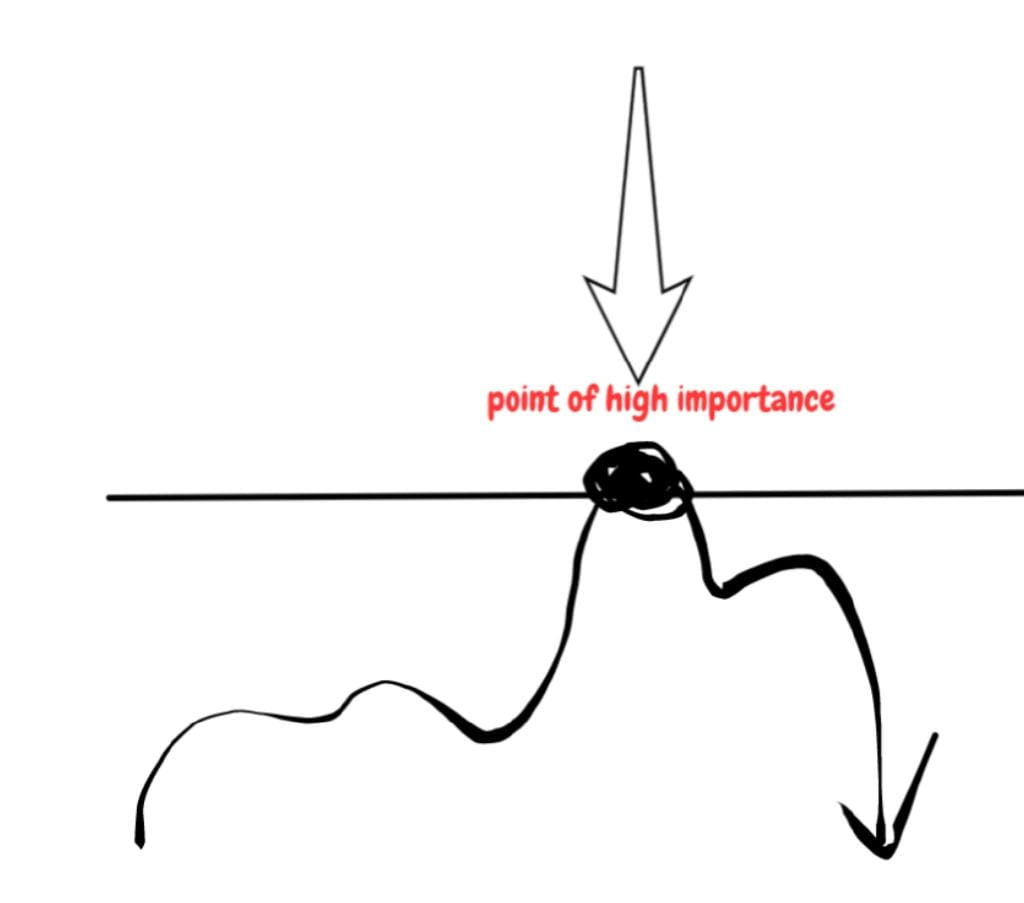
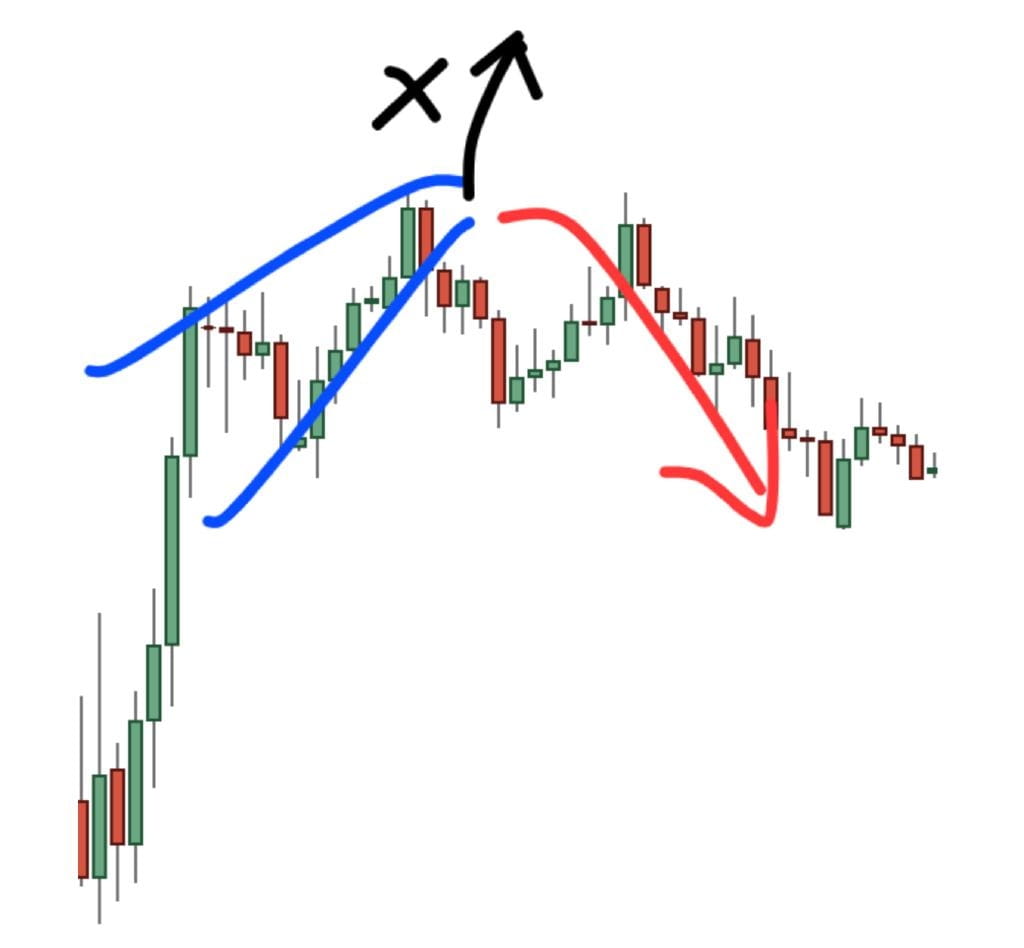
Price Action Pattern #8: Theory and Reality 2 (TVR2)
Let's look at the last price action chart pattern.
Of course, this does not mean we have explained all price action patterns.
These 8 price action patterns are just some common ones in our daily trading.
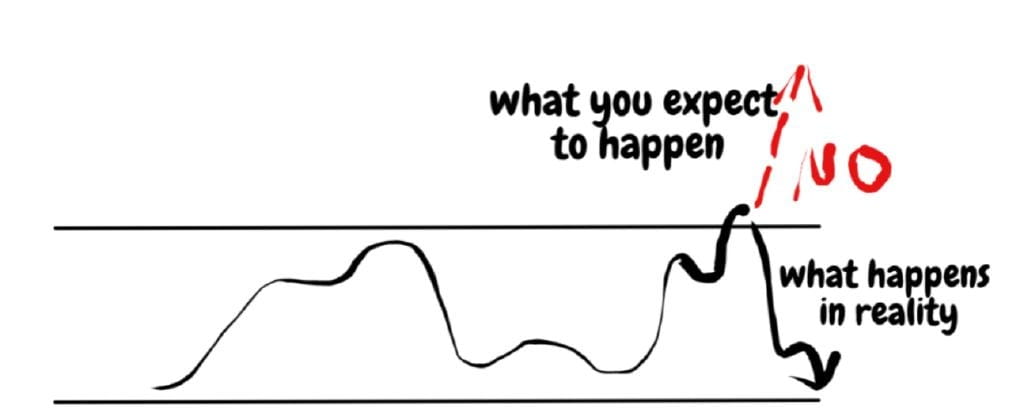
So, what can we expect from price action patterns?
When we see the price fluctuating in a range, we expect a breakout to occur. Traders can easily fall into this trap.
The closer the price gets to the resistance level, the more eagerly they buy.
Let's illustrate it with a sketch:
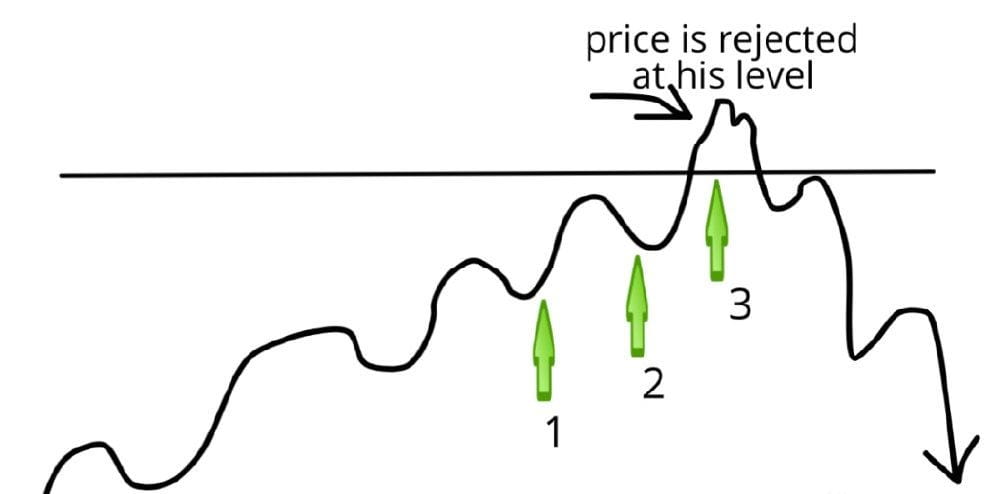
Here are 3 scenarios that novice traders hope to go long:
1. The price is slightly above the midpoint of the range, I should go long, otherwise I will miss the opportunity.
2. The price is just below the resistance level; I worry that if the price rises too quickly, I will miss the best entry opportunity.
3. The price has just broken through the resistance level, and I don't want to miss this trading opportunity.
The above three situations are typical trading methods for retail traders. This is a trap you should try to avoid.
The closer you get to the resistance level, the higher your stop loss will be; paradoxically, the chance of being stopped out increases.
If you can look at it from another perspective, you can get a good trading opportunity.
Think this way: the closer you are to the resistance level or supply area, the more you should short.
Let’s take the USD/CAD 4-hour chart as an example:
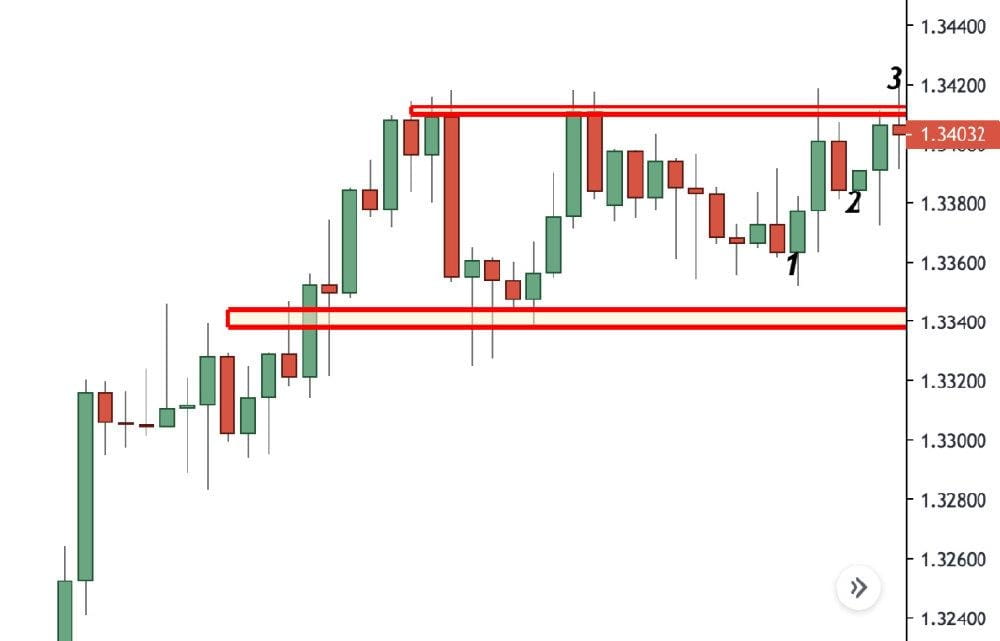
Seeing this situation, you might rush in to go long. However, the reality is as shown in the following chart:
How unfortunate! You did not short, but went long...
Summary
In this article, we listed 8 price action chart patterns. They all have their respective advantages and disadvantages.
However, what everyone really needs to consider is the potential return of each price chart and the risks involved.
These trading patterns tell us that traders can easily fall into market traps, thus we must strictly adhere to trading rules.
Trading may be the best way to test your discipline.
Please remember, do not rush to enter trades with overly high expectations.
If you want to become a consistently profitable trader, it will require a lot of time, discipline, and dedication.
Finally, I wish you successful trading!
There are many common situations of emotional exploitation. The following three are the most common.
1. Fluctuations within the range.
When the individual currency experiences fluctuations, it is actually the main force targeting retail investors.
During the process of up and down fluctuations, if retail investors buy more, then the price will likely end with a significant drop. If retail investors sell more due to panic, then after fluctuations, the price is likely to rise instead of fall.
2. Chasing highs and cutting losses
Chasing highs and cutting losses is also the most common emotion. Behind this is the fear of missing out and the fear of being trapped.
The emotion of chasing highs and cutting losses is also easily exploited by the main force; when many people chase highs, the main force often finds it easy to offload.
In the morning, there was a significant inducement to buy, and in the afternoon, it could drop sharply to show retail investors. Letting the following orders lose over 10% in a single day is also the same. The main forces just happen to make a round of washing, allowing retail investors to panic and exit. Chasing highs and cutting losses should not be the price of cryptocurrency, but the trend. Retail investors' half-knowledge makes them the prey of funds.
3. Bearish and bullish news.
Another point is that both bearish and bullish sentiments are utilized by the main forces; bearish news can suppress the price of the currency and can also be interpreted as the end of bearish sentiment, leading to a significant rise in the currency price. Similarly, bullish news can lift the currency price along with the trend or can be used to push prices higher for offloading.
So how bullish and bearish news itself is interpreted is determined by the funds.
How funds operate is actually based on market reactions and retail investors' actions.
Retail investors panic, greedy money buys in, once retail investors are greedy, funds immediately flee.
Utilizing emotional exploitation, funds really do it to perfection, you could say they can handle it with ease.
Please remember! Resisting emotions is the only way for retail investors.
Exploring the world of digital currency is like understanding the true meaning of life. Once you grasp the wisdom of life, the mysteries of the cryptocurrency circle will also become clear. The path of simplicity lies in the integration of knowledge and action, enabling you to operate effortlessly and confidently!
The Aze team still has positions, believe first and then achieve, guiding you out of confusion, follow Aze's pace closely, Aze only trades real ETH and SOL contracts. Contracts are not about luck, but about solid technical analysis, the latest news, and a wealth of operational experience. If you want to join Aze, please pay attention to #加密市场反弹 #加密ETF十月决战 .