The past period has seen many investors experiencing extreme confusion when witnessing Gold (XAU/USD)—an asset dubbed the "ultimate safe haven"—sliding down in the worst price drop since 1983.
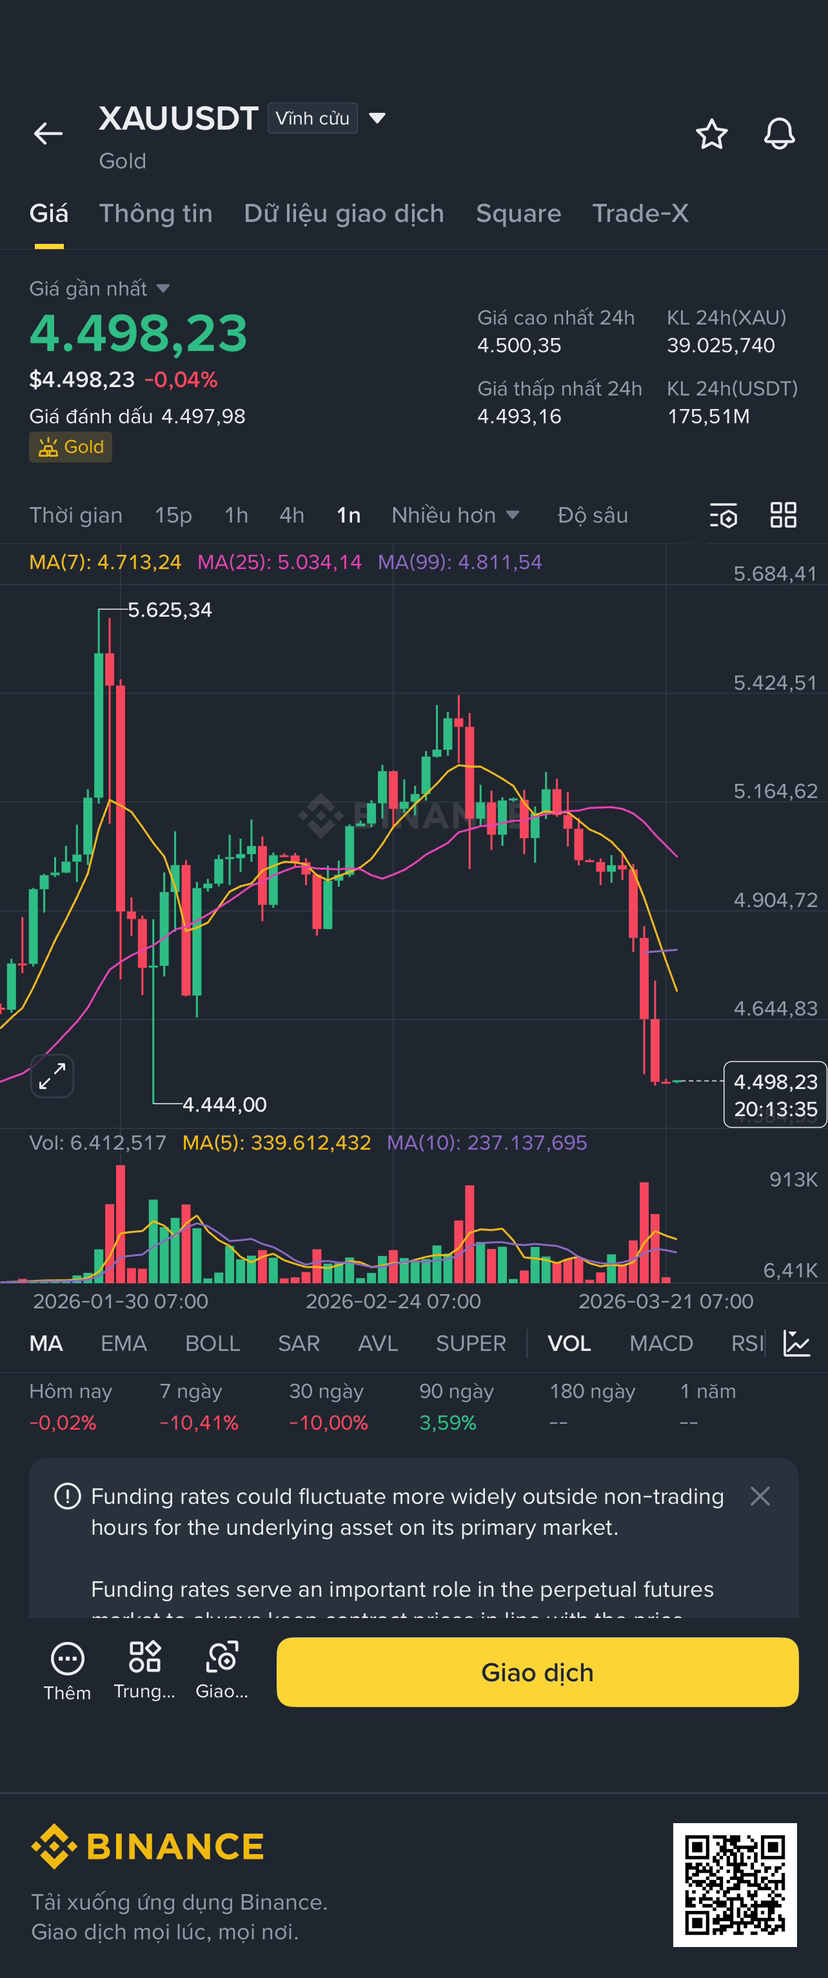
From the all-time high of 5,608.35 USD/ounce set in January 2026, gold has evaporated approximately 18.5%, falling straight down to the range of 4,488 - 4,497 USD/ounce by the end of March. The paradox is that this crash occurred right in the eye of the storm of geopolitical tension and the global energy shock. As someone closely following institutional cash flows, I want to share my perspective on dissecting the market structure so we can see clearly: This is not illogical, but rather the brutal consequence of a cross-liquidity crisis.
The Paradox of the "ATM": When the Shelter is Brought Out as a Savior
According to traditional theory, macro risk explosions are when capital flows strongly into gold. But in reality, March 2026 is following a completely different scenario: Cross-asset liquidation.
Conflict in the Middle East pushes WTI oil prices above 100 USD/barrel, igniting inflation and crushing global stock markets. As multi-asset portfolios evaporate thousands of billions of USD, hedge funds face enormous margin calls. In a severe cash crunch, they are forced to liquidate their most liquid assets. Paper Gold—with an accumulated yield of 65% in 2025 and the deepest derivative liquidity—becomes the ideal "ATM" for institutions to withdraw cash to cover losses.
Monetary Chains: The Fed's Pivot and the Domination of DXY
The underlying reasons for breaking the upward trend of gold lie in the monetary policy of the Federal Reserve and the absolute strength of the USD.
* Unexpected "Hawkishness": Although the Fed keeps the federal funds rate unchanged at 3.5% - 3.75% in the mid-March meeting, the Dot Plot chart dealt a severe blow by projecting only one rate cut of 0.25% for the entire year of 2026.
* Increasing opportunity costs: The core pricing equation of the financial market is expressed as r_{real} = i_{nominal} - \pi^e (Real yield equals nominal interest rate minus expected inflation). When the Fed signals to keep interest rates high (i_{nominal}) to combat stubborn inflation, real yields (r_{real}) soar. Gold—an asset that does not provide periodic yields—immediately faces liquidation from institutions to pivot to safer yielding assets like U.S. Treasury Bonds.
* The "Petrodollar" Effect: Energy conflicts force countries to frantically hoard USD to pay for expensive oil imports. This surge in demand drives the DXY index to break through the 100 threshold, nearing 101.14. The stronger the USD, the more expensive gold becomes for investors holding other currencies, directly squeezing international demand.
Technical Analysis: The Death Thresholds of XAU/USD
The nearly 18.5% decline has caused extremely severe structural damage to the chart. Algorithmic trading funds (CTA) have officially pivoted from Buying to Selling. The fact that spot gold prices break through the 50-day moving average (SMA 50) confirms that the market is shifting to a distribution state. The current technical heatmap revolves around the following death zones:
* Structural Resistance Zone (4,996 - 5,027 USD): This is a very strong psychological level, aligning with the 50-day SMA. It acts as a trend reversal point; gold is only truly safe if it reclaims this area.
* Short-term Resistance Zone (4,660 - 4,680 USD): The initial resistance level that bulls need to overcome to halt the local decline, equivalent to the 61.8% Fibonacci extension from the peak.
* Current Support Zone (4,504 - 4,550 USD): The old bottom of the accumulation phase at the end of 2025. Gold is testing the resilience of this support.
* Death Zone (4,200 - 4,251 USD): Aligns with the 200-day EMA. This is the absolute boundary between the bull market and the bear market. Breaking this level, the entire long-term bull supercycle will collapse.
Capital Flow Diversification and Transmission Effects in Vietnam
On the macro picture, ETF cash flow is panic-selling. The SPDR Gold Trust (GLD) has seen a net outflow of 28 tons of gold in just 5 trading sessions. However, on the flip side, Central Banks (like China and India) are still diligently accumulating to diversify reserves, creating a solid long-term "structural floor."
Risk warning in the domestic market of Vietnam:
The collapse of global price charts is sending violent shockwaves into the domestic market, putting buyers at extreme "double loss" risk. By the end of the week of March 21-22, 2026, the SJC gold price has plummeted from the peak of 187 million VND/tael to 171 million VND/tael (selling price), causing peak buyers to lose 16 million VND/tael in just a few weeks.
Worse still, with the converted global price (including taxes) only around 142.6 million VND/tael, the domestic gold market is maintaining an absurd premium of nearly 30 million VND/tael. Along with the buy/sell spread being widened by businesses up to 3 million VND, any attempt to "catch the bottom" of domestic physical gold at this moment is extremely risky.
3 Strategic Scenarios for the Second Half of 2026
The future pricing trajectory will not be linear but will depend on which variable (interest rates, inflation, or geopolitical issues) will take control:
* Base Scenario (Accumulation & Slow Recovery): The Fed keeps interest rates high, inflation cools down gradually. Demand from Central Banks creates a strong floor. XAU/USD fluctuates steadily and aims for 4,800 - 5,055 USD/ounce by Q4 2026.
* Positive Scenario (Stagnation & Aggressive Rate Cuts): The energy shock pushes the global economy into stagnation inflation. The Fed is forced to cut rates sharply to save liquidity. Gold explodes, aiming for 5,400 - 6,000 USD/ounce.
* Negative Scenario (Liquidity Crisis): Core inflation remains stuck at high levels, and the Fed completely dismisses the expectation of rate cuts. DXY surges, bond yields explode. Gold breaks through the 200-day EMA, triggering margin calls and sliding down to 4,200 USD, even facing the risk of dropping to 3,500 USD.
The modern financial market is extremely ruthless: the safest assets are often the first to be liquidated. At this point, risk management discipline around the 4,500 USD mark is vital for any portfolio.
#Vàng $XAU #MacroFinance #Fed #Vietnam