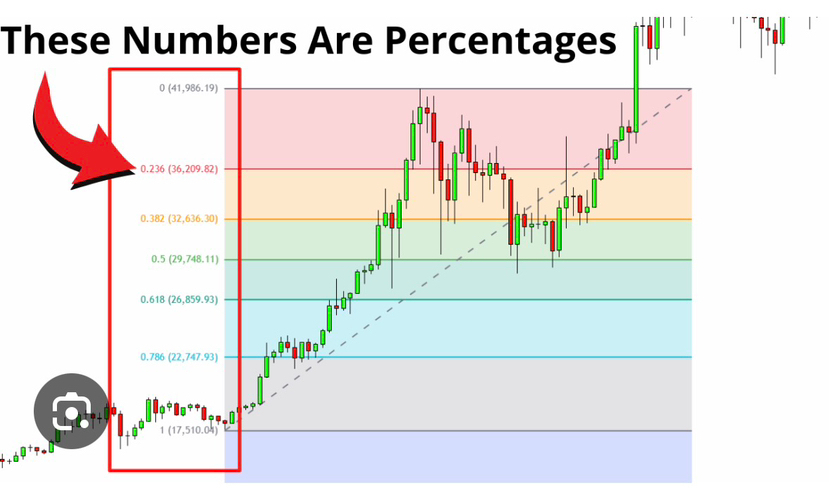
How it works (short):
You take a move from low → high (or high → low)
Draw Fibonacci levels between them
Key levels: 23.6%, 38.2%, 50%, 61.8%, 78.6%
What it means:
Price often retraces (pulls back) to these levels
Then it may bounce and continue the trend
Example:
Price goes from $100 → $200
It might drop to around $161 (61.8%) and bounce up again
👉 Used to find:
Entry points
Stop-loss levels
Trend continuation zones