Technical indicators point to a possible reversal in BTC's relative performance, while some traders are watching to see if key support levels can hold.

Bitcoin
BTC 70.000 usdt
has been in a bear market against gold for 14 months, with the BTC/GOLD ratio and momentum indicators at historical lows that previously marked cycle bottoms.
Key points:
The BTC/GOLD ratio is at historical lows, while multiple indicators suggest a cycle bottom.
The price of Bitcoin must remain above $70,000 to avoid a sharper decline in the coming weeks.
The RSI and MACD of the BTC/GOLD ratio show a classic reversal signal
TradingView data reveals that the relative strength index (RSI) of the BTC/GOLD ratio has begun to rise.
The weekly RSI reached its most extreme oversold level, 21, in mid-February, indicating that bearish momentum is fading.
Similarly, the moving average convergence/divergence (MACD) indicator has fallen to its lowest level in history and is about to produce a bullish cross.
It is worth noting that previous bullish crosses, especially those that occurred after the RSI recovered from oversold conditions, marked macroeconomic lows for the ratio.
This ultimately led to a price increase of Bitcoin ranging from 280% to 620% against gold, as seen in 2019, 2021, and 2023.
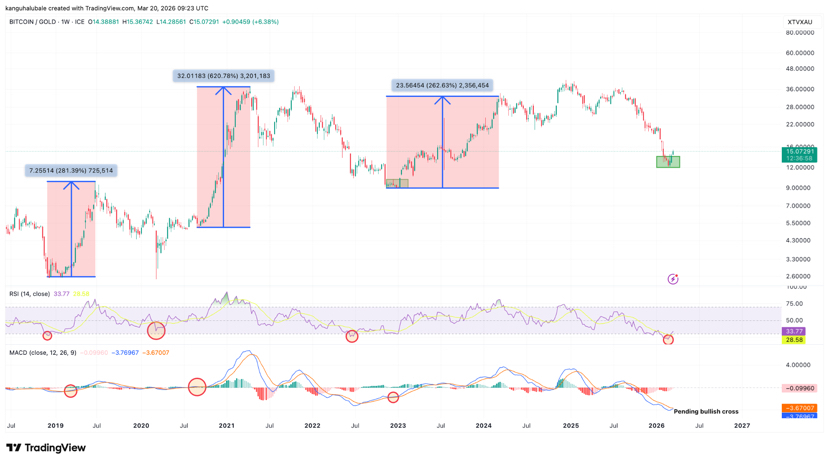
The RSI has now recovered to 33 from 21 in mid-February. Combined with a buy signal on the MACD, the outlook begins to resemble previous cycles.
“The bottom has already been reached for $BTC against gold,” said technical analyst James Easto in a post on X on Friday, adding that “the scenario is set” for Bitcoin's recovery.
The last time Bitcoin reached a low against gold was in November 2022. This marked the beginning of a price surge of BTC by 700% to its current all-time high of $126,000.
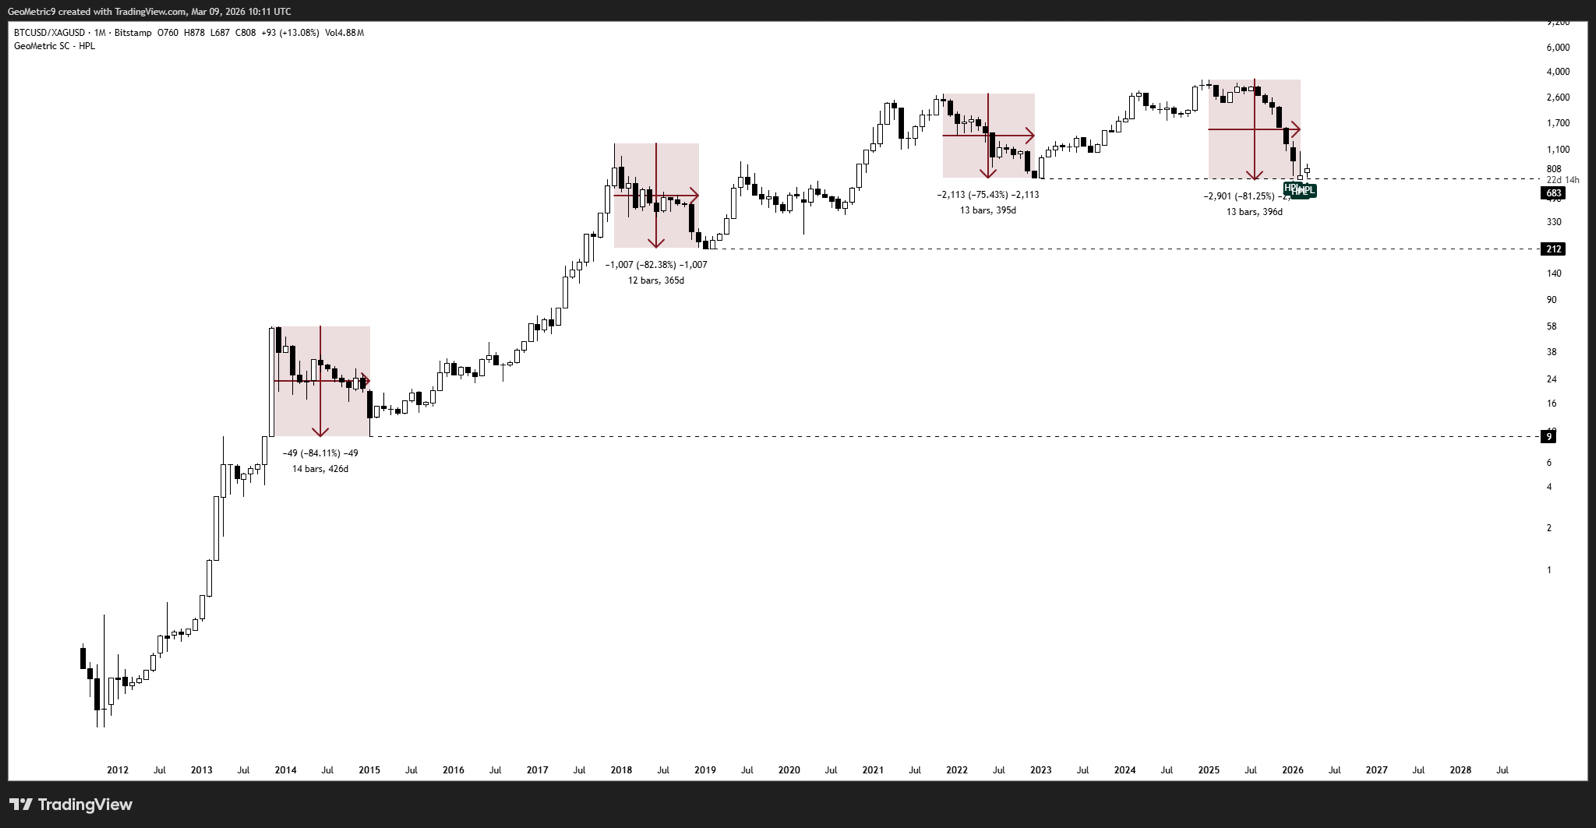
GeoMetric analysts noted that the last three bear markets of the BTC/GOLD ratio lasted between 12 and 14 months, with declines ranging from 75% to 84%.
About 13 months have passed in the current cycle, which “so far has dropped 81%, surpassing the bear market of 2021,” said the analysts, adding:
“We believe there are strong arguments to think that here we could be facing a possible bottom.”
The investor and crypto analyst Fergani echoed both scenarios mentioned earlier, saying that:
“For more than 13 years, we have seen the same pattern: Bitcoin enters a bear market against gold that lasts approximately 400 days. During that time, the RSI falls into deep oversold territory. Historically, these phases have always marked the bottom.”
The price of Bitcoin must remain above $70,000
Meanwhile, the BTC/USD pair remains cautiously bullish as long as it stays in the support zone of $68,000-$70,000. This is where the 200-week exponential moving average (EMA) and the 50-day simple moving average sit.
The 200-week EMA constitutes a key support band for BTC's price during bear markets, and some analysts warn that its reliability could be tested in the weekly close on Sunday.
Bitcoin analyst AlphaBTC stated that he was confident Bitcoin would recover to $80,000 before falling to $50,000, provided that the price remained above the weekly low of 68,800 dollars.
“I don’t want to lose this week’s low, otherwise it will fall back to the range lows or even lower!”
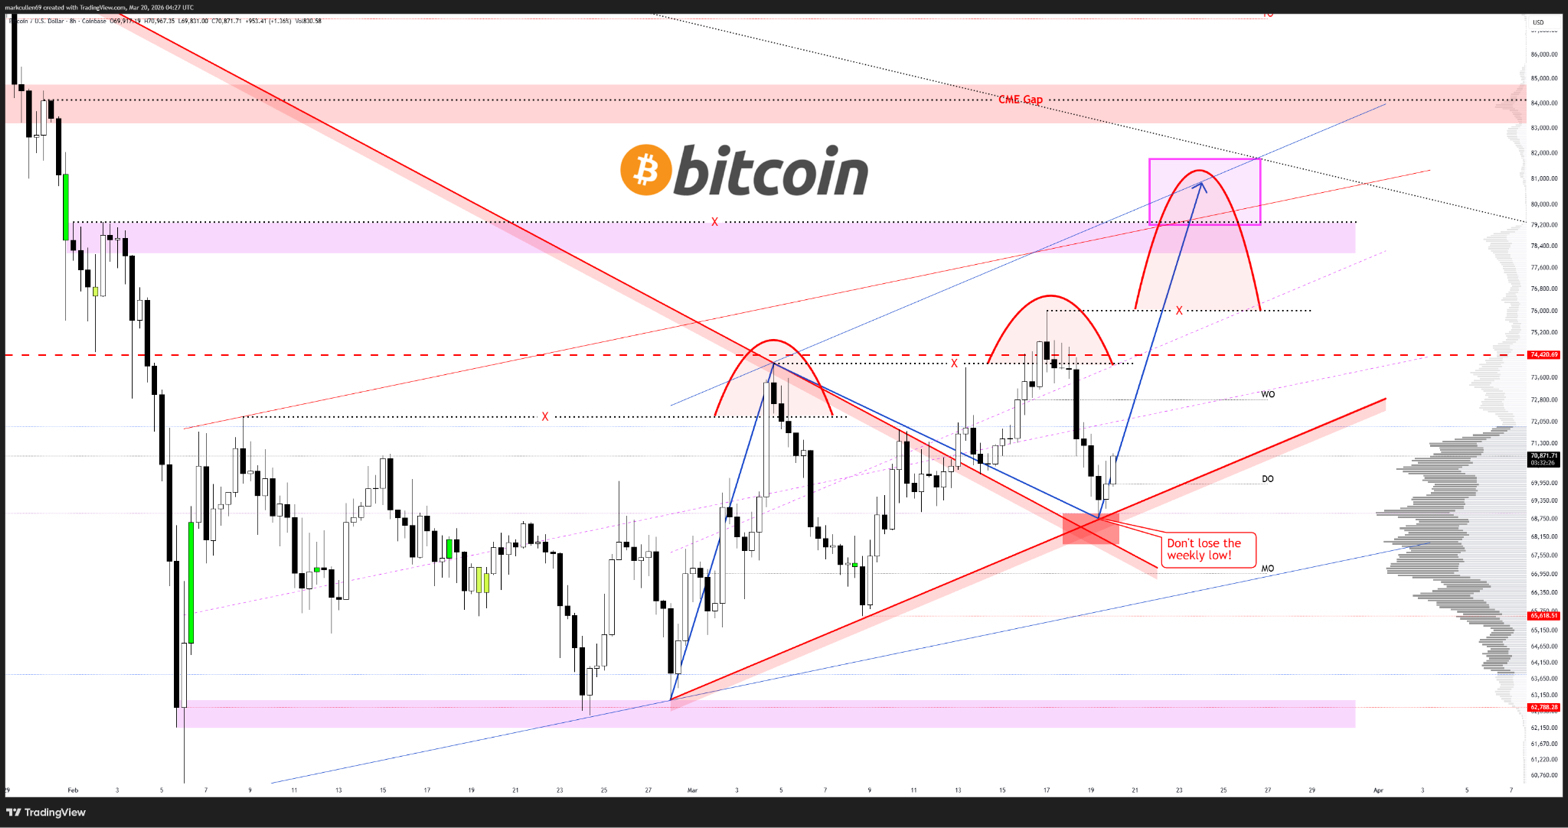
Staying at $70,000 would align with a previous fractal recovery trajectory, paving the way towards $76,000-$80,000.