March 20, 2026 20:08
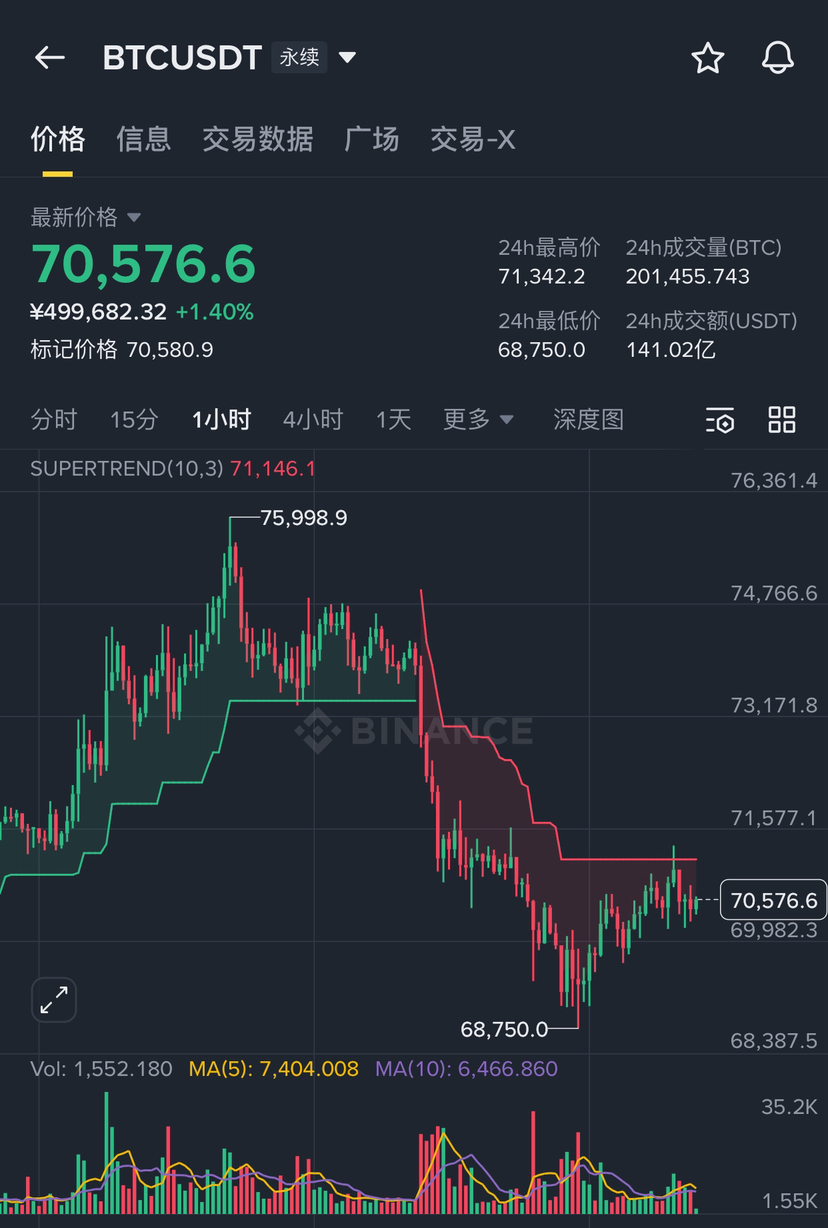
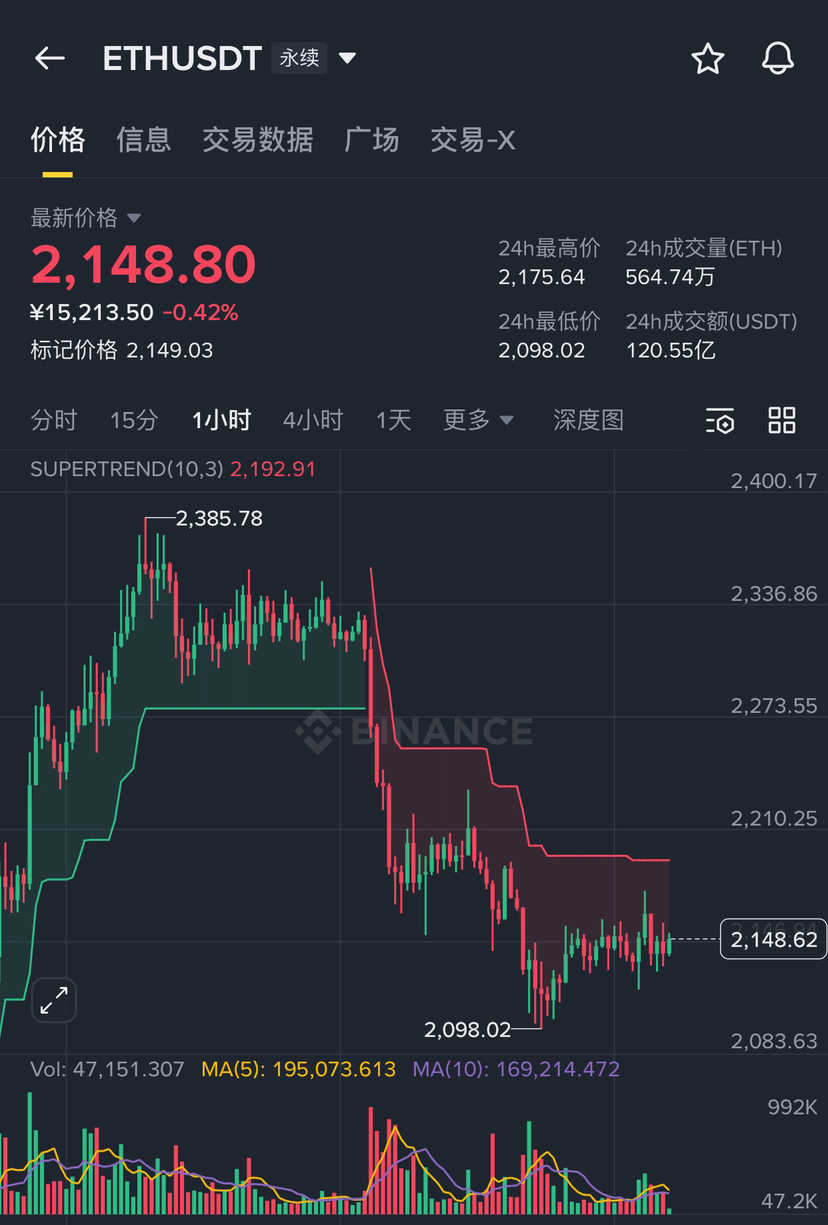
Bitcoin is at 70,576, Ethereum at 2,148. On the surface, today is green, up 1.4% and down -0.42%, but don't be fooled by this number. Look at the chart; Bitcoin has dropped from a high of 75,998 to 68,750, a decrease of nearly 7,300 dollars, while Ethereum has fallen from 2,385 to 2,098, losing nearly 300 dollars. Is the current small rebound really stable, or is it a dead cat bounce? The SuperTrend on the 1H is still entirely red, and the answer to this question has not yet emerged.
Bitcoin's chart shows a beautiful green uptrend on the left and an ugly red staircase downtrend on the right. Starting from 75,998, the SuperTrend turned red, and the price descended step by step until it stopped at 68,750. Now at 70,576, it has rebounded nearly 1,800 dollars from the low, but the SuperTrend resistance is still pressing down at 71,146, with the current price below that resistance. The volume is 1,552, MA5 is 7,404, MA10 is 6,466, and the volume is less than the beginning of the moving averages, making it highly likely that this rebound won't hold. The highest in the last 24 hours only reached 71,342, failing to break through the resistance line, indicating that there is significant pressure above.
The decline of Ethereum is even more exaggerated. It fell from 2,385 to 2,098, a drop of nearly 13%, more severe than Bitcoin. Now at 2,148, the SuperTrend 1H resistance is at 2,192, which is still 44 dollars away from the current price. Today's high was 2,175, which also failed to break through the resistance and returned. The trading volume is 47,151, MA5 is 195,073, and MA10 is 169,214, with the volume being less than one-third of the moving average, similar to Bitcoin—no volume during the rebound indicates weak buying intentions, and those holding coins are waiting for an opportunity to sell.
The core issue in both charts is the same: having fallen from a high position, the SuperTrend is still red, the rebound volume is severely insufficient, and the resistance line is right above, unable to break through, just providing better entry points for shorts.
Bull-Bear Probability
BTC|Current price 70,576
📉 The rebound is blocked, and it is expected to test 69,000–69,500 again (40%)
The resistance at 71,146 has no volume support, making it difficult to break through. After a brief surge, it was pushed back, and floating capital has stop-lossed out, facing a second test at the low of 68,750. Only if it holds can it be considered a true bottom; if it doesn’t hold, continue to look for it.
⚖️ Oscillation in the range of 70,000–71,200 waiting for direction (30%)
The volume is too low, with no clear signals for either bulls or bears, just grinding back and forth in this range. Tonight, before the U.S. stock market closes, it may remain in this state, consolidating without breaking out.
🚀 Volume breakout above the resistance at 71,146, SuperTrend turns green (20%)
It is necessary for the volume to quickly return above MA5 and effectively stand above 71,146 for the SuperTrend to potentially turn green. Once it turns green, the upper range of 72,000–73,000 can be looked at. But currently, the volume conditions are very far from sufficient; a clear external catalyst is needed.
☠️ Breaking below the low of 68,750 accelerates the drop to 67,000 (10%)
Once a low is broken, stop-loss orders will be triggered, and the range of 67,000–67,500 is a relatively important support area below. Whether it can hold there is another matter, but the process of dropping will be very quick.
ETH|Current price 2,148
📉 The resistance at 2,192 is pressing down, and it tests near 2,100 on the way back (40%)
Today's high of 2,175 couldn’t even reach the resistance, and with such low volume, a brief surge and then a return is highly probable. The low of 2,098 is recent support, and whether it can hold during the second test is key.
⚖️ Low volatility oscillation in the range of 2,100–2,175 (30%)
It is oscillating back and forth between the lows and resistance, waiting for BTC to show its stance first. Ethereum has had no independent market during this period; it doesn’t move if BTC doesn’t move, just dragging along.
🚀 Breaking through the resistance at 2,192, aiming for 2,210–2,250 (20%)
If BTC can effectively turn green, Ethereum will follow and break through 2,192. There is a batch of trapped positions waiting in the range of 2,210–2,250, but once it stands above, the pressure will be much smaller. Currently, the volume cannot support this movement.
☠️ Breaking below 2,098, it may test 2,050 or even 2,016 (10%)
Once the low is broken, this wave of rebounds will be completely over, with the lower levels of 2,050 and 2,016 being two important supports, looking down for the bottom sequentially.
On the operation side:
Falling from 75,998 to 68,750, having dropped so much, many people's first reaction is 'I should have bought'. But the SuperTrend is still red, the resistance line is above, and the volume hasn’t returned; buying at the bottom during this time is counter-trend, it’s not cheap, it’s a trap.
For shorts, if it rebounds to around 71,100–71,200, there are signs of stagnation, and you can consider entering with a light position, placing a stop-loss above 71,400, targeting 69,500. The same applies to ETH; if it rebounds to around 2,185–2,192 and shows resistance signals, it can be considered, with a stop-loss above 2,210.
Wait for SuperTrend to turn green before going long; currently, testing the bottom is betting, not trading.
⚠️ The content is for reference only and does not constitute investment advice. The market has risks; make independent decisions.
$BTC $ETH $BNB #币安Alpha第二波CYS空投 #OpenAI拟推出桌面超级应用 #字节跳动确认出售沐瞳 #AnimocaBrands投资AVAX #币安KOL引荐计划