Food for thought and understanding efficiencies ↓
📊 Now:
the price was already near ATH and has now slightly pulled back �
CryptoSlate
short-term there is a drawdown/cooling (this is what you see on the 30m)
the overall trend has not yet been broken
🧠 What does the situation mean right now
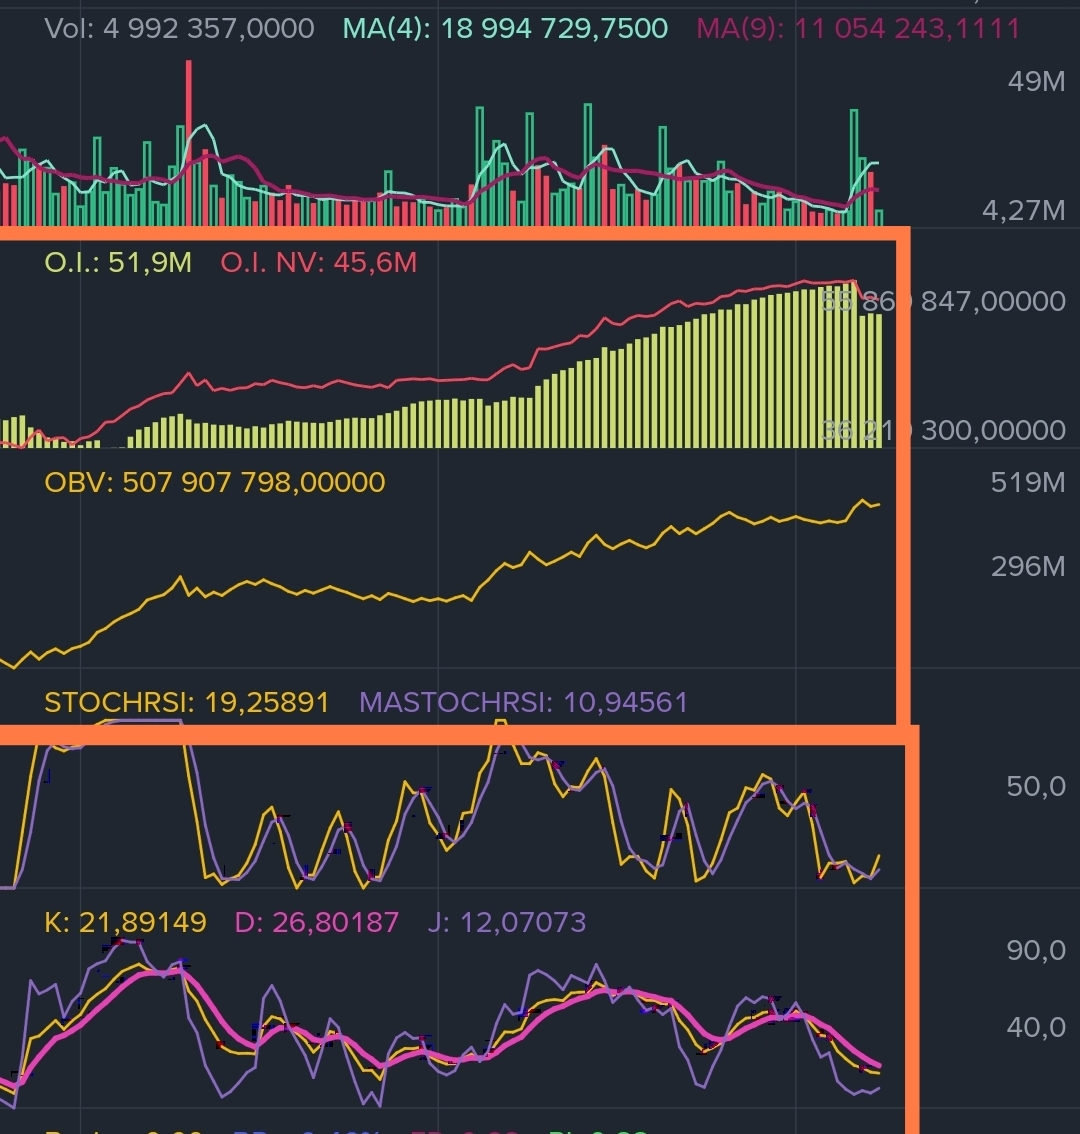
You see:
the price is slowly falling
Stoch RSI ↓
KDJ ↓
OBV ↑
OI ↑
👉 This is a very specific pattern:
🔥 1. Slow decline = NOT panic selling
If there was a real reversal down:
the price would fall sharply
OBV would be falling
And here: ➡️ the decline is controlled, 'soft'
💰 2. OBV is rising = someone is buying
This is key:
while the price is sliding → there is a buyback
this is classic accumulation on a pullback
📊 3. OI is rising = new money is entering
And here are two options:
or they are building longs
or they are building shorts
BUT 👇
⚠️ The most important thing is the combination
👉 OBV ↑ + price ↓
👉 this is bullish divergence
That is:
volume says 'buying', while the price is not reacting yet
🎯 Conclusion on this case

👉 Most likely:
🟢 This is accumulation before an upward impulse
or
🟡 Taking out weak longs before the rise
❗ Alternative (less likely, but possible)
If:
OI is rising very aggressively
and the price will continue to fall
👉 then this could be:
🔴 building shorts (and then there will be another drop)
🧩 How to distinguish right now
We look at 2 things:
Reaction at levels
there is pressure and bounces → bullish
just 'sliding without reaction' → weakness
Liquidations / candles
long lower shadows → buyback → long
no shadows → pushing down → short dominates
💡 Briefly for a trader
👉 What was described is NOT a signal to 'short blindly'
Rather:
the market is preparing for a move and gathering liquidity.
p.s. what do you think about this?*))
#Example #indicator #analises #Write2Earn #Squar2earn