1. Technical aspect: The game at key levels
71,000 USDT is the last psychological barrier before the historical high of 73,777 USD. A narrowing decline at this position usually indicates strong buying pressure during a downturn, making it difficult for bears to push the price lower. This is a typical test of support; if it holds, it is often seen as a consolidation before a breakout.
2. Long and short game: Market cleanup after liquidation
The market shows a narrowing decline over 24 hours, indicating that there may have been a sharp drop beforehand, leading to the liquidation of highly leveraged longs. After the cleanup, selling pressure lessens, allowing major funds to push the market higher at a lower cost. This 'fall then stabilize' trend is typically viewed as **washing out** rather than a trend reversal.
3. Macro background: Liquidity expectations support
Recent US inflation data and Federal Reserve policy are core variables. If the US dollar index weakens or the market's expectations for interest rate cuts increase, risk assets will benefit first. Additionally, the capital flow of Bitcoin spot ETFs is crucial; if it shows net inflows recently, it indicates that institutions are still accumulating during the dips.
4. Potential risks
If this is just a downward continuation, 71,000 USDT may become a trap for a 'false breakout.' Pay attention to news related to Mt. Gox compensation or government wallet movements, as these often lead to sudden sell-offs.
I. Market interpretation
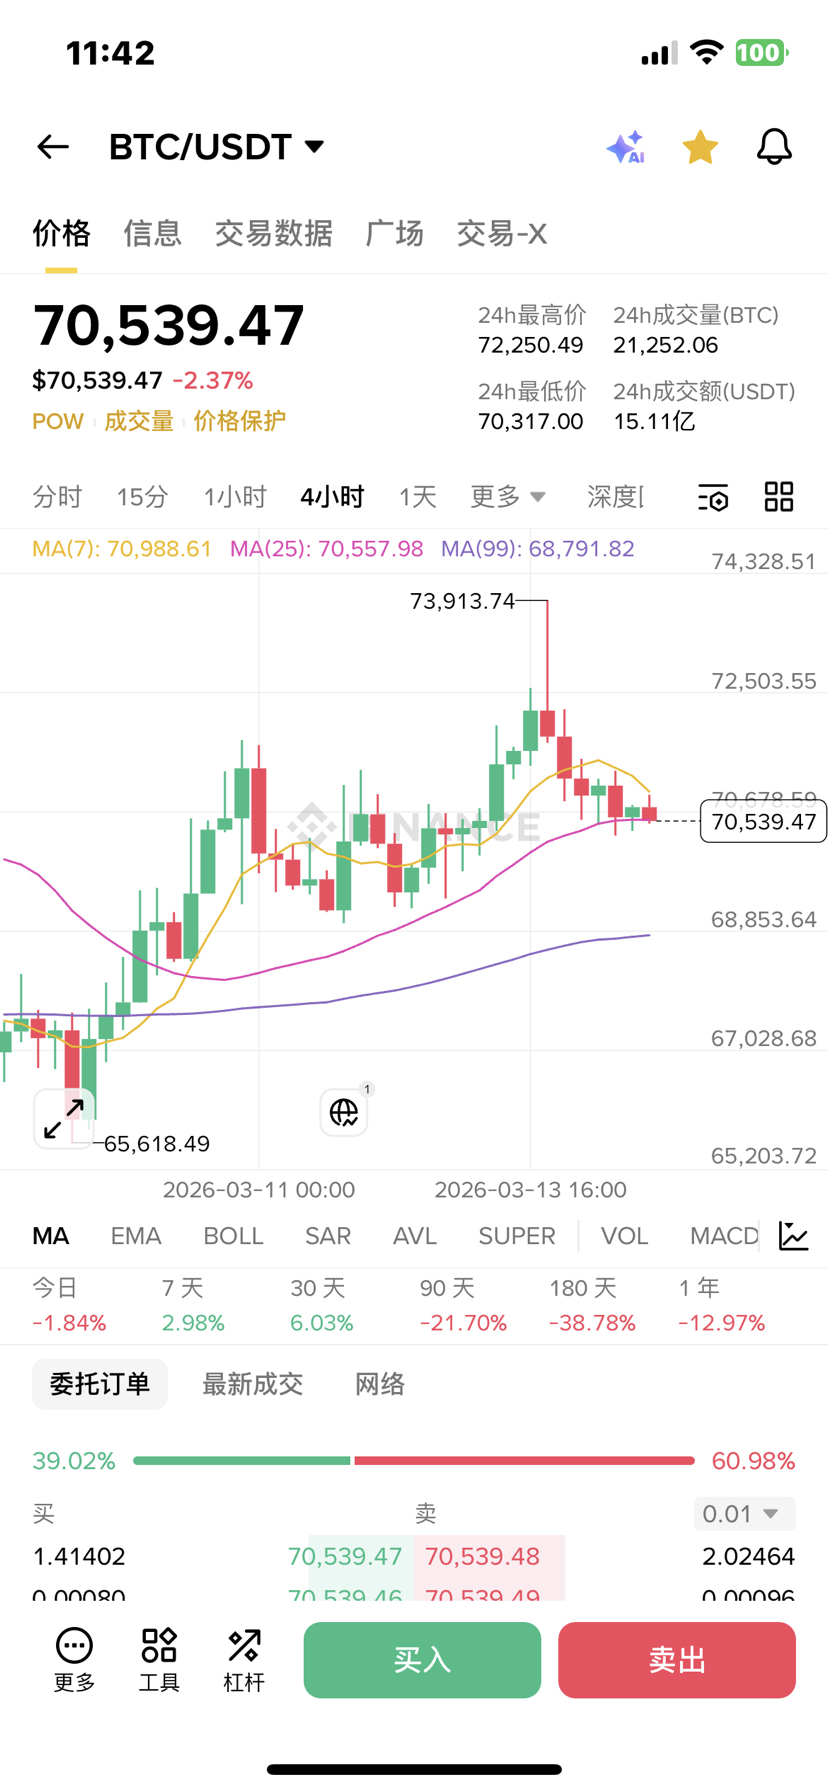
• Price and rhythm: Breaking through 71,000 USDT, the decline quickly narrows, showing effective support and strong buying strength, with 71,000 becoming a new battleground for bulls and bears.
• Volatility characteristics: After a sharp decline, quickly stabilizing, in line with the typical rhythm of profit digestion and support reconstruction in a bull market, with intensified capital games under high volatility.
• Capital signals: Continuous net inflows into spot ETFs (about 180.4 million USD on March 14), rising open interest in futures contracts, institutions and leveraged funds entering the market simultaneously.
II. Drivers and Suppressing Factors
• Positive drivers: ① Continuous inflows into ETFs, supporting institutional allocation demand; ② Increased expectations for macro easing, with the market betting on interest rate cuts; ③ Breakthrough of the psychological barrier at 71,000, boosting sentiment.
• Suppressing factors: ① Strengthening US dollar index and volatility in US stocks creating pressure; ② Profit-taking pressure at high levels; ③ Geopolitical conflicts (e.g., Iran situation) causing fluctuations in risk aversion preferences, or affecting capital flows.
III. Key technical points
• Support levels: 70,000 (round number + previous dense trading area), 69,200 (short-term moving average zone).
• Resistance levels: 71,500 (previous high + trapped positions), 72,000 (round psychological level).
• Indicator signals: MACD golden cross at low levels on an hourly basis, RSI rebounding, short-term momentum recovering; the daily line needs to maintain above 71,000 to confirm trend continuation.
IV. Risk warnings
• Leverage risk: Under high volatility, derivative liquidations may trigger sharp price declines, requiring control over positions and leverage.
• Macro and geopolitical: A stronger US dollar, inflation data exceeding expectations, or escalating geopolitical conflicts may impact the market.
• Capital withdrawal: Slowing ETF inflows or profit-taking by institutions may lead to weakened support.
V. Actions and observations
• Short-term: Relying on support from 70,000 to 70,500, try to go long with a light position; if it breaks below 70,000, then watch or reduce positions.
• Mid-term: Focus on ETF capital flows and signals from the Federal Reserve policy, waiting for opportunities to buy on dips after corrections.
Key observations: ① The effectiveness of maintaining above 71,000; ② Daily net inflow data for ETFs; ③ Changes in geopolitical situation.