March 26, 2014 BTC weekly divergence at the bottom, about to face a breakout upwards, how to grasp the next steps?
The weekly MACD divergence of Bitcoin has been in a narrow range for 35 days, currently facing pressure around 74000. Once it breaks through, there is a chance to first reach around 80000. Ethereum's weekly chart also shows a bottom divergence, approaching the pressure level and facing a breakout.
In terms of the US stock market, I have been reminding everyone about the high-level fluctuations for months, with the gap between highs not widening, and a pullback expected later. Since late January, it has been in a downward trend, and for the time being, the risk of decline remains relatively high. Gold and silver have been in a narrow range since January 30 after experiencing a historic decline, which is also what I've been saying, the probability of reaching a local peak is getting larger.
Bitcoin
Bitcoin's daily Bollinger Bands are opening, and it is currently facing resistance around 74000. If it breaks through, there is a chance to reach around 80000 or even higher, but precautions should be taken to avoid false breakouts, similar to the previous pullback at 98000.
The daily MACD histogram shows a trend of gaining altitude, with the fast and slow lines consistently moving upwards. There are two resistance levels above: one is 78900 and the other is 84300. For now, we are still looking at a rebound in the short term.
Support: 68500—71300
Resistance: 78900—84300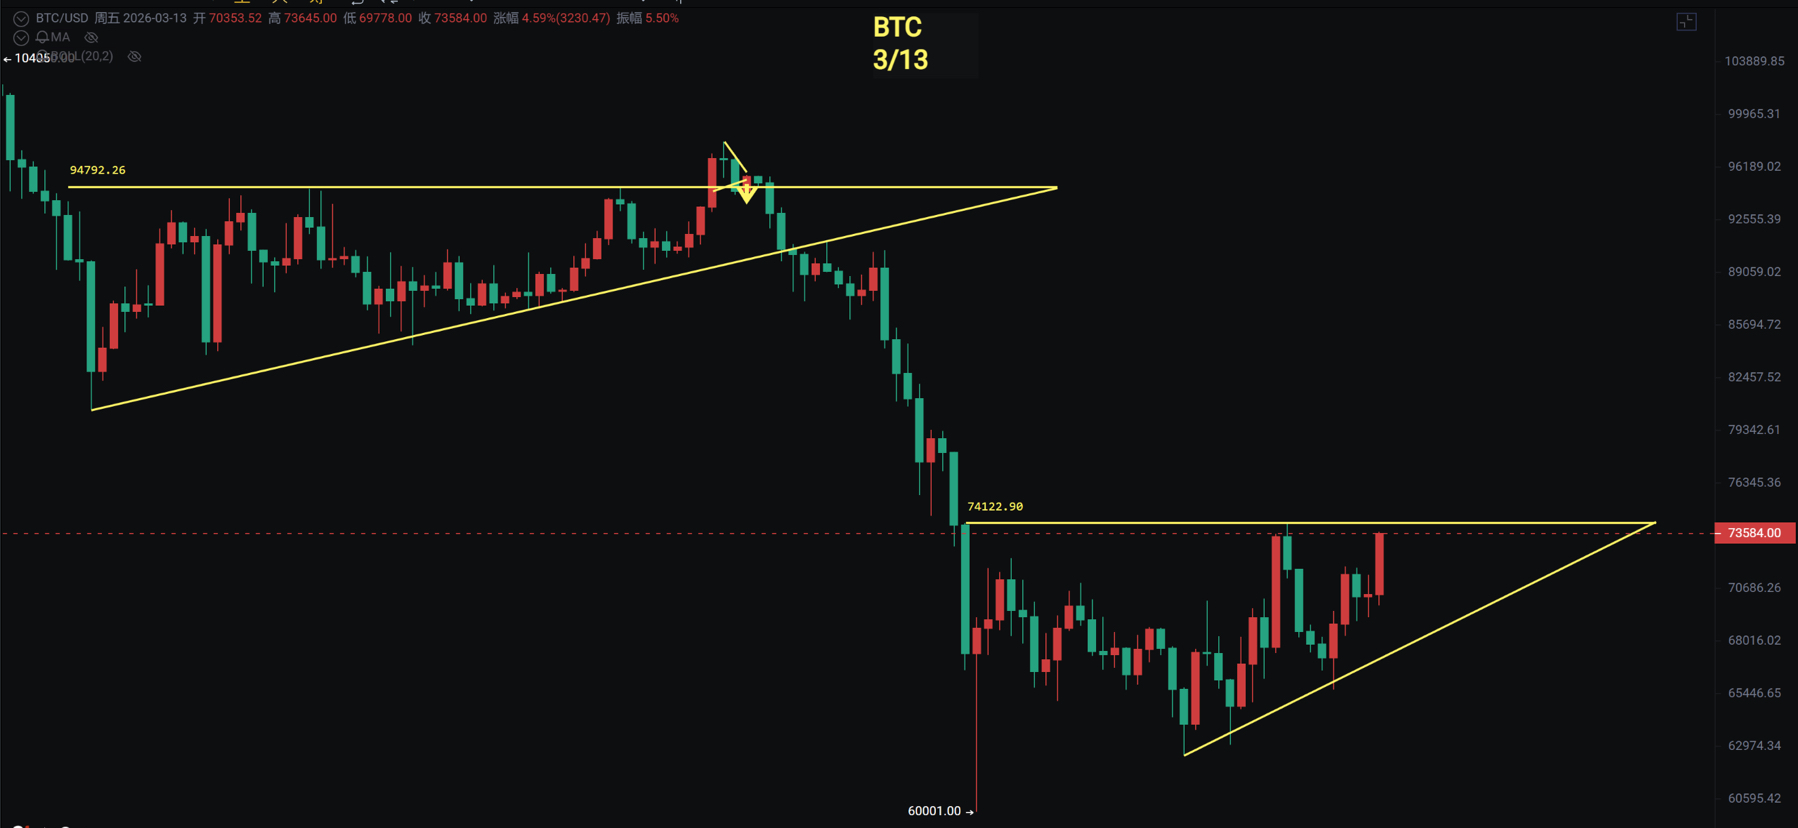
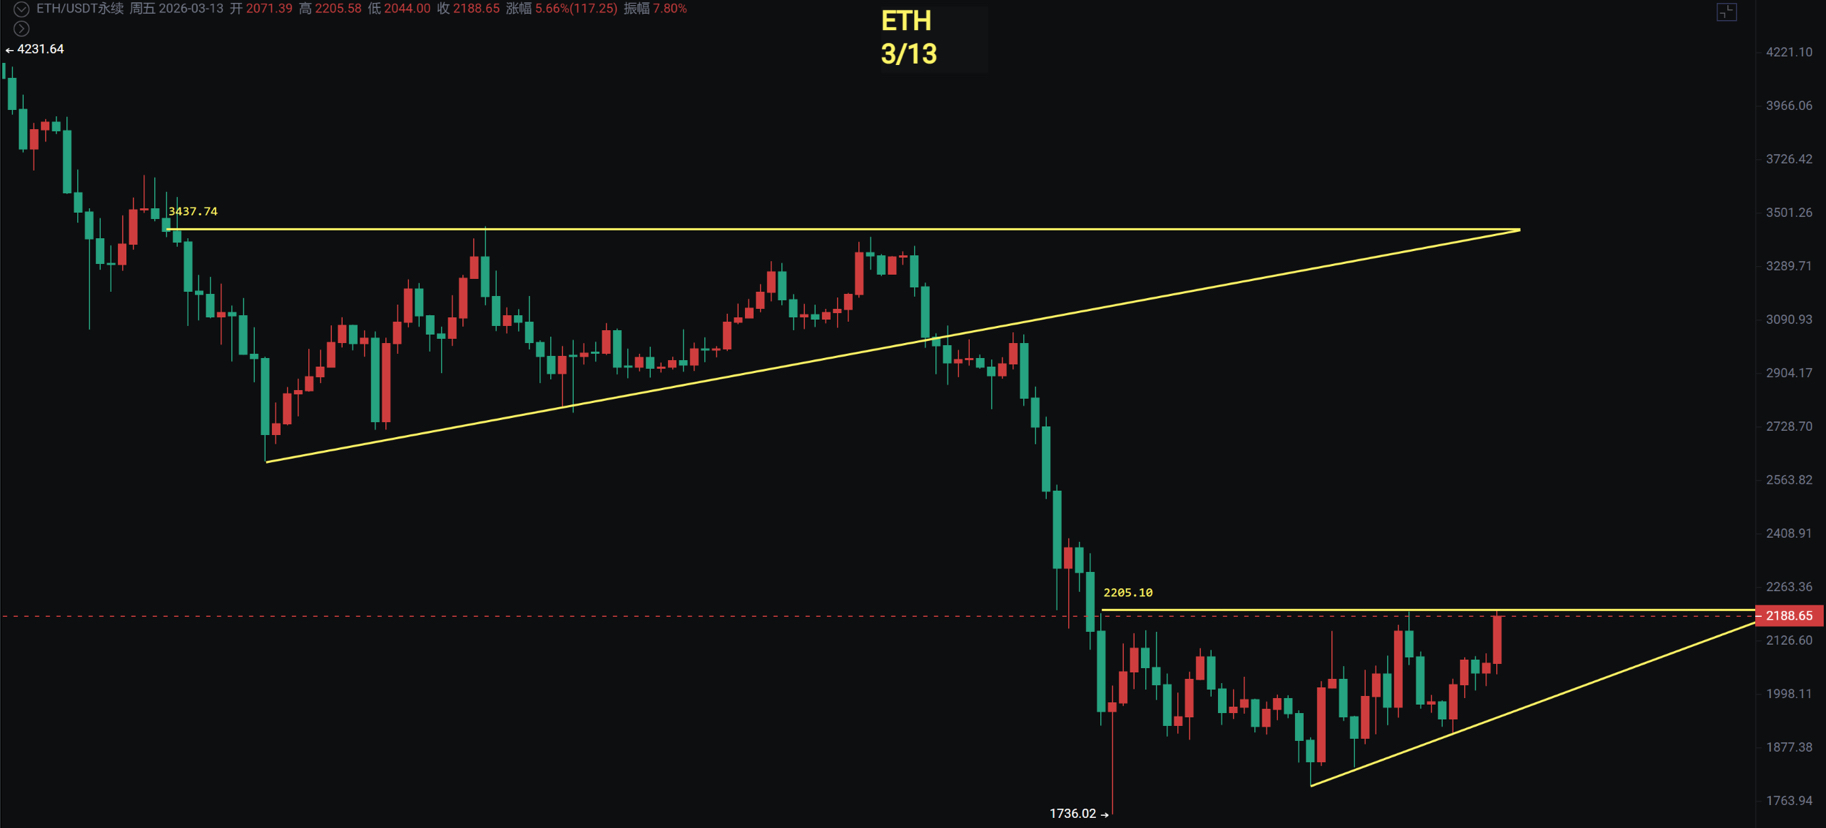
Ethereum
As of the time of writing, Ethereum has reached 2200, which is also the resistance level for maintaining a 35-day consolidation. Currently, the probability of a breakout still seems high. The daily MACD has been above the zero axis, with signs of increasing momentum after a pullback, and the fast and slow lines continue to rise.
Daily upward rebound resistance levels: 2380—2575—2770
Support: 1900—1990
Resistance: 2380—2575—2770