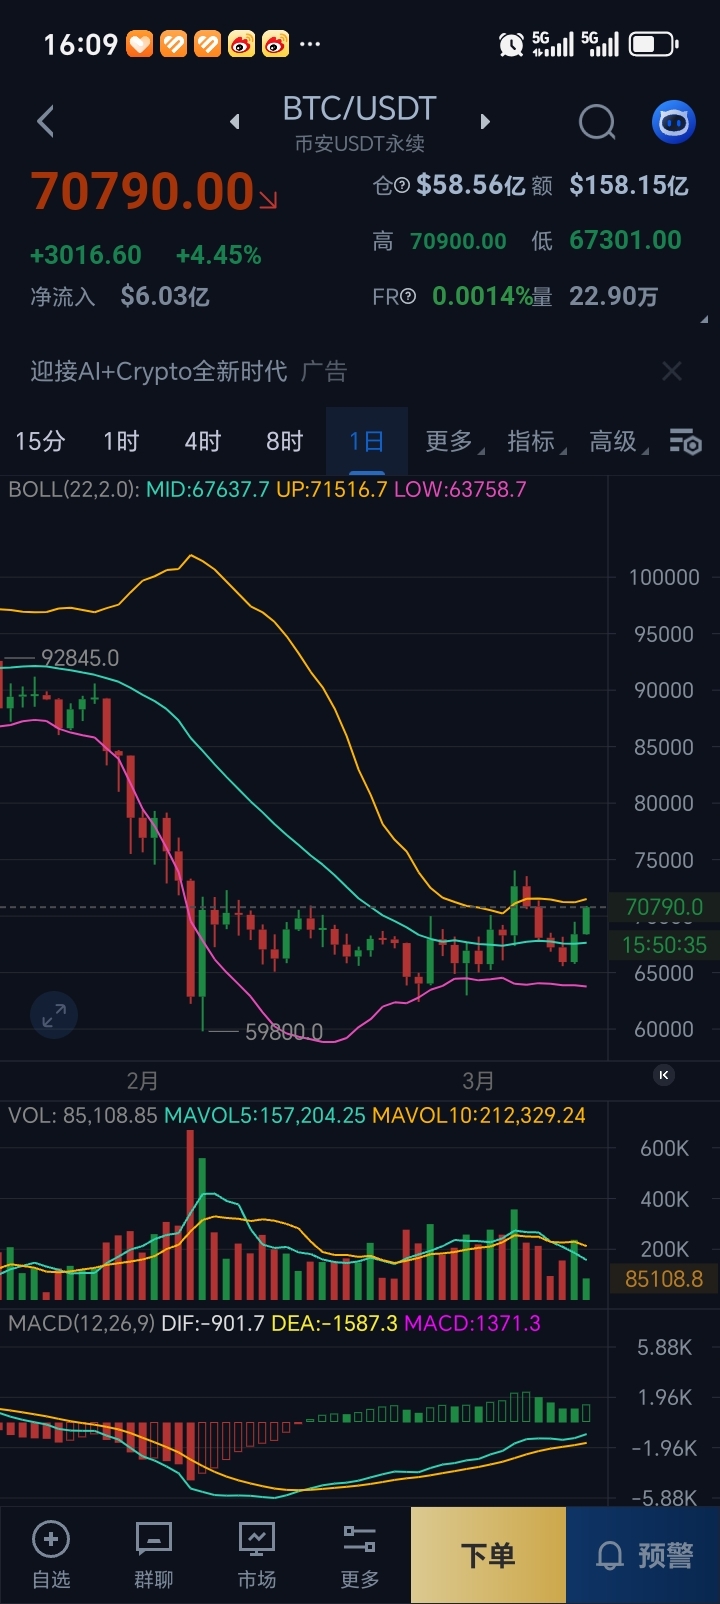
1. Current Price and Trend Situation
- Current Price: 70790 USDT, Daily Increase +4.45%, Net Capital Inflow 603 million USDT, with strong short-term bullish sentiment.
- Price Range: Intra-day high and low points 67301–70900 USDT, having broken through the upper edge of the recent trading range.
2. Technical Indicator Breakdown
- Bollinger Bands (BOLL)
- Middle Band: 67637.7, Upper Band: 71516.7, Lower Band: 63758.7
- The price is above the middle band, approaching the upper band, with a short-term bullish bias; if it breaks through the upper band at 71516, it may open up further upward space; if it retracts, the middle band at 67637 is a key support.
- Volume (VOL)
- Current trading volume: 85108.85, below the 5-day and 10-day average volume (157000/212000).
- Indicates that the current rebound volume is average, driven by existing funds, and sustainability needs subsequent volume verification.
- MACD
- DIF(-901.7) > DEA(-1587.3), MACD bars are positive, and the green bars are gradually increasing.
- Represents the exhaustion of bearish momentum, bulls begin to counterattack, a golden cross signal appears on the daily chart, and the short-term trend turns bullish.
3. Review of Mid-term Trends
- In mid-February, it fell from a high of 92845 USDT, reaching a low of 59800 USDT, completing a deep correction.
- Since March, it has been oscillating in the range of 65000-70000, and the current price has returned to the upper edge of the oscillation range, and the bottom pattern is gradually becoming clear.
4. Key Judgments and Operational Suggestions
- ✅ Short-term (1-3 days): Bullish bias, target at the upper track of the Bollinger Bands 71516 USDT, if it breaks through with volume, it could reach around 73000; support level at 67637 (Bollinger middle track).
- ⚠️ Mid-term (1-2 weeks): Need to pay attention to whether the trading volume continues to increase, if there is no follow-up volume, it is likely still oscillating in the range of 65000-72000; if it breaks below 65000, it may test the previous low around 60000 again.
- 📌 Risk warning: Cryptocurrency volatility is extremely high, the current rebound is a corrective rise, not completely detached from the previous downtrend, do not blindly chase high, it is recommended to control positions and set stop losses.
5. Summary of Core Signals
Indicator Signal Meaning Operation Reference
Price + BOLL has crossed the middle track, attacking the upper track. Buy on dips, reduce positions near the upper track.
MACD golden cross formed, bullish momentum initially appears. Trend turns bullish, can try to buy with light positions.
Trading volume is insufficient, rebound is questionable. Do not chase high without volume, be wary of a pullback after a rise.