🚨 $BTC Liquidation Map Alert — Shorts vs Longs
Current Market Conclusion
Asset: Bitcoin $BTC
Current price: ~ $67,100 – $67,200
24h range: ~ $66,600 – $68,180
BTC is currently consolidating in the $66K–$68K zone, forming a short-term liquidity battle between bulls and bears.
📊 Key Liquidation Zones
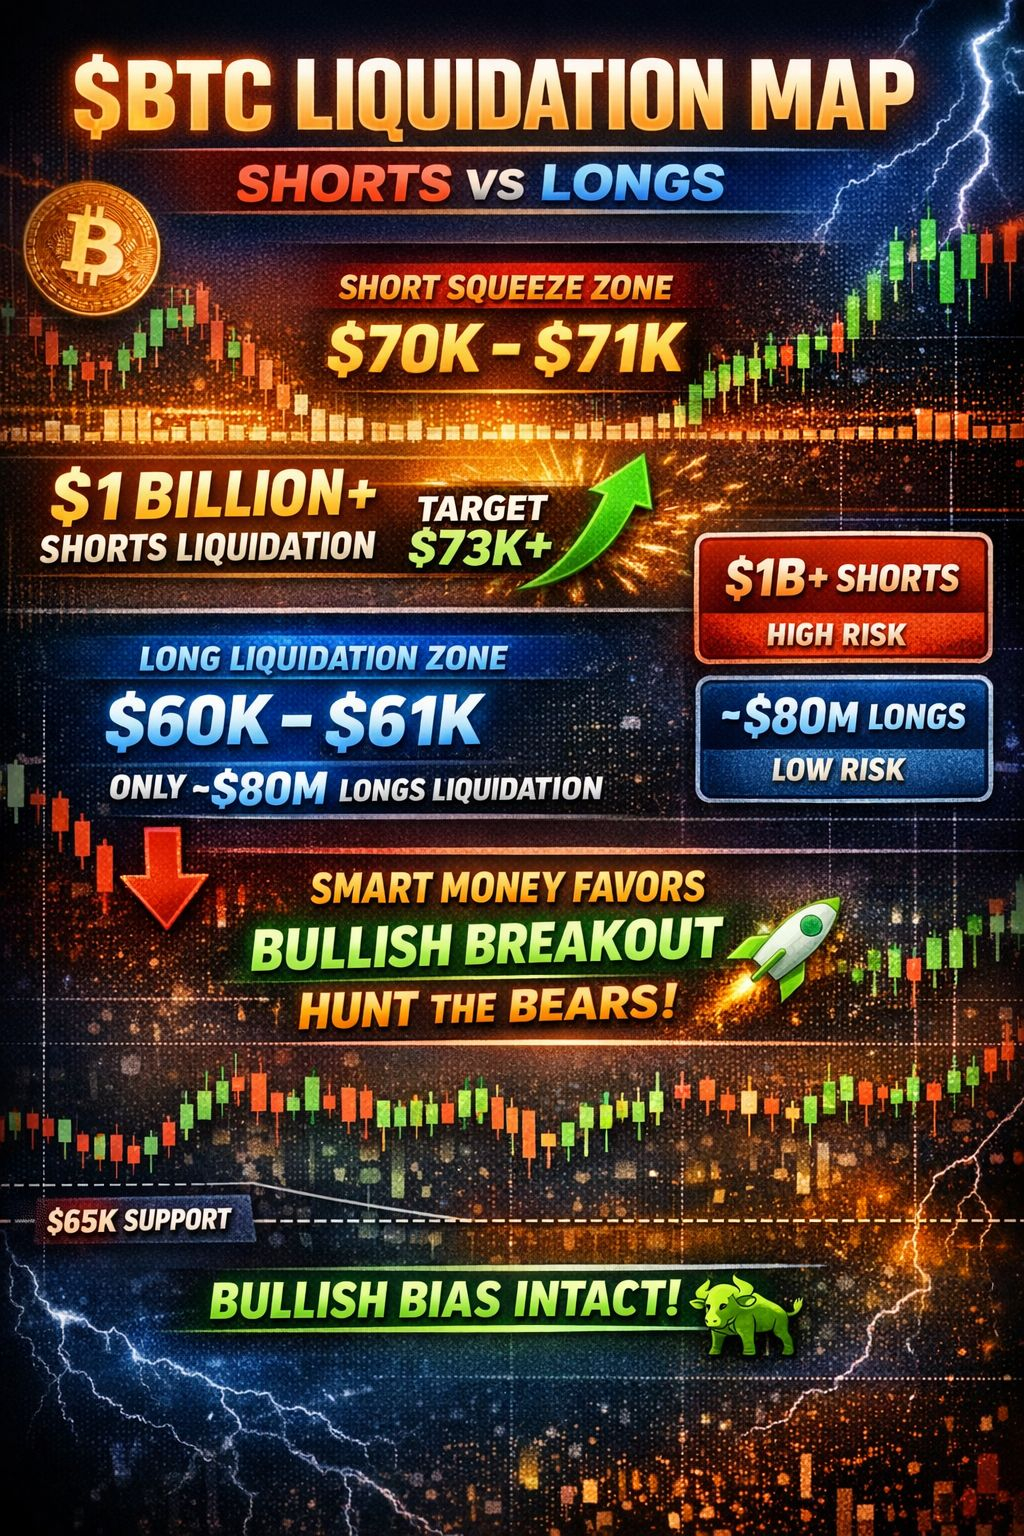
🔥 Upside Liquidity (Short Squeeze Zone)
If BTC breaks above $70K – $71K:
Over $1 billion in short positions could be liquidated.
This area is packed with leveraged bearish bets.
A breakout here could trigger a cascade of forced buybacks, pushing price rapidly higher.
Result:
➡️ Potential short squeeze rally
➡️ Momentum could accelerate toward $73K–$75K
📉 Downside Liquidity (Long Liquidation Zone)
If BTC drops to $60K – $61K:
Only around $80 million in long positions are at risk.
Compared to the massive short liquidation cluster above, this downside liquidity is relatively small.
Result:
➡️ Less fuel for a downside cascade
➡️ Bears have weaker liquidation pressure
🧠 Smart Money Interpretation
Professional traders often look for liquidity pools where the market can move to trigger maximum liquidations.
Right now:
Level
Liquidation Impact
Market Bias
$70K–$71K
$1B+ shorts
Bullish squeeze potential
$60K–$61K
~$80M longs
Limited downside fuel
This imbalance suggests:
Market makers may target the upside liquidity first.
In simple terms:
💰 There is far more money to liquidate above than below.
📈 Technical Context
BTC recently rejected the $72K region, showing strong resistance.
Current consolidation near $67K support indicates accumulation.
As long as $65K support holds, the broader structure remains bullish-neutral.
Key levels to watch:
Support: $65K → $63K
Resistance: $70K → $72K
A daily close above $70K could ignite a liquidation-driven rally.
🐂 Market Bias
Given the liquidation imbalance + structural support, the short-term bias remains:
➡️ Bullish pressure toward the $70K liquidity zone
In other words:
The market may hunt the bears before the bulls.
🚀 Conclusion
The liquidation map shows a massive short trap above $70K.
Downside liquidation pressure is comparatively weak.
If momentum builds, a short squeeze could fuel the next BTC rally leg.
Bullish bias remains intact unless $65K breaks decisively.
#Trump'sCyberStrategy #RFKJr.RunningforUSPresidentin2028 #JobsDataShock #AltcoinSeasonTalkTwoYearLow #SolvProtocolHacked