The art of reading the markets: Technical analysis and its hidden drivers
Technical analysis is not simply drawing lines on a screen; it's the science of reading and understanding the psychology of traders and translating it into measurable numbers and data. To succeed in this market, especially during times of crisis (such as wars, disasters, or any unforeseen events), you must combine "technical indicators" with the "movement of leading currencies."
First: Technical standards (trend tools)
The metrics are the "compass" that tells you where the price is headed. These metrics are divided into three main categories:
1. Trend Metrics
The most famous of these are moving averages.
-MA7 and MA25: express the short-term trend. MA99 represents the "steel wall" or long-term trend.
-The golden rule: When the price is above all averages, we are in an "uptrend," and any dip is just a "buying correction."
2. Momentum Metrics
The most important of these is the Relative Strength Index (RSI):
It measures the speed and strength of price movement.
Above 70: The price is "overbought" (beware of a correction).
Below 30: The price is "oversold" (an opportunity to buy at the bottom).
3. The scale of truth (Volume)
Trading volume is the fuel. Any price rise without high trading volume is a "false rally" that could collapse at any moment. Volume is what distinguishes "whales" (institutions) from "small fish" (amateur traders).
Second: The impact of leading currencies ($BTC $ETH )
This is the most important part of your strategy. In the crypto world, Bitcoin (BTC) is the "leader" or "magnet".
1. Positive Correlation
Alternative currencies (Altcoins) often follow Bitcoin by a large margin.
If Bitcoin explodes upwards, alternative currencies will follow (after a short period of liquidity absorption).
If Bitcoin collapses (due to news of war, for example), alternative currencies will collapse at a much higher rate due to their smaller liquidity compared to it.
2. Bitcoin Acquisition ($BTC )
This metric tells you where the cash goes:
Increased acquisition: Liquidity is leaving alternative currencies and entering Bitcoin (and this poses a risk to your trades in other currencies).
Declining acquisitions as Bitcoin stabilizes: "Altcoin season" (the best time to make big profits).
Third: How do you integrate all of that into one strategy?
In order to make a decision to buy or sell, you must follow the "top-down analysis" sequence:
General situation: Are there any news reports of wars, disasters, or any major incidents? (This is considered a major influence on the markets).
Leader status: Is Bitcoin stable, rising, or falling?
Technical indicators: Is the price at support (MA)? Is the RSI low?
Confirmation: Has the green "volume" started to appear?
- Advice and observation
Technical analysis is not a 100% guarantee; it's merely a set of predictions and probabilities. A successful trader is one who secures a small, guaranteed profit rather than waiting for a large one that could vanish due to unexpected news.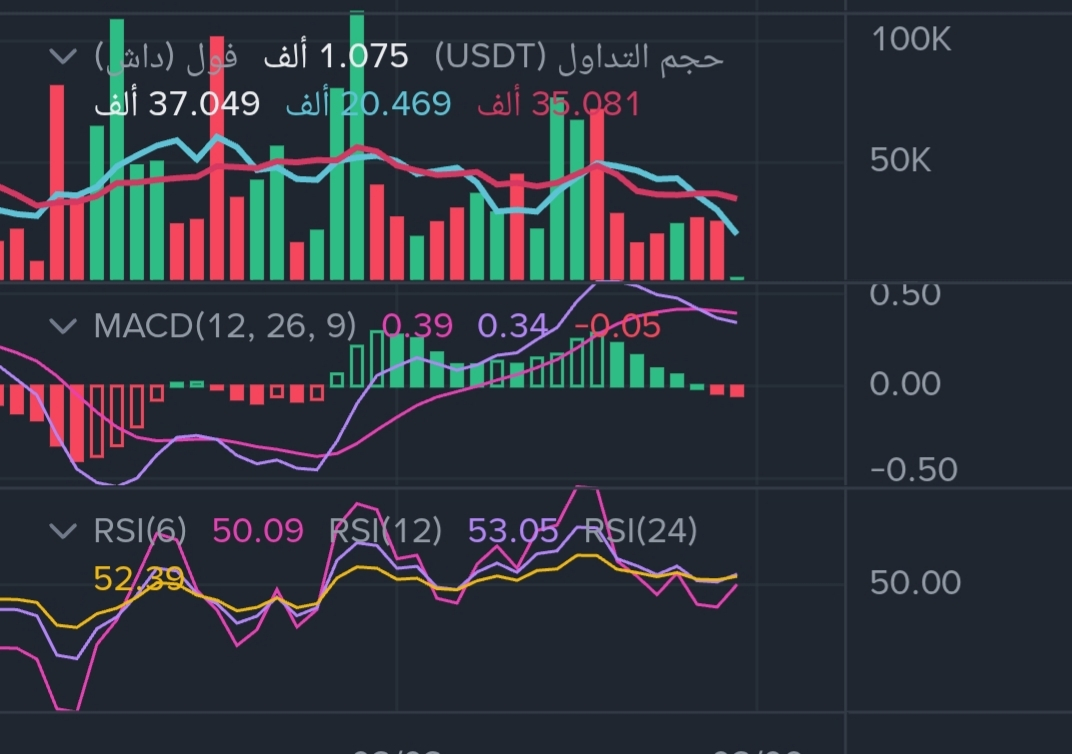
#PriceAction #CryptoSignals #CryptoMarket #Bitcoin #Ethereum