Market Analysis Summary
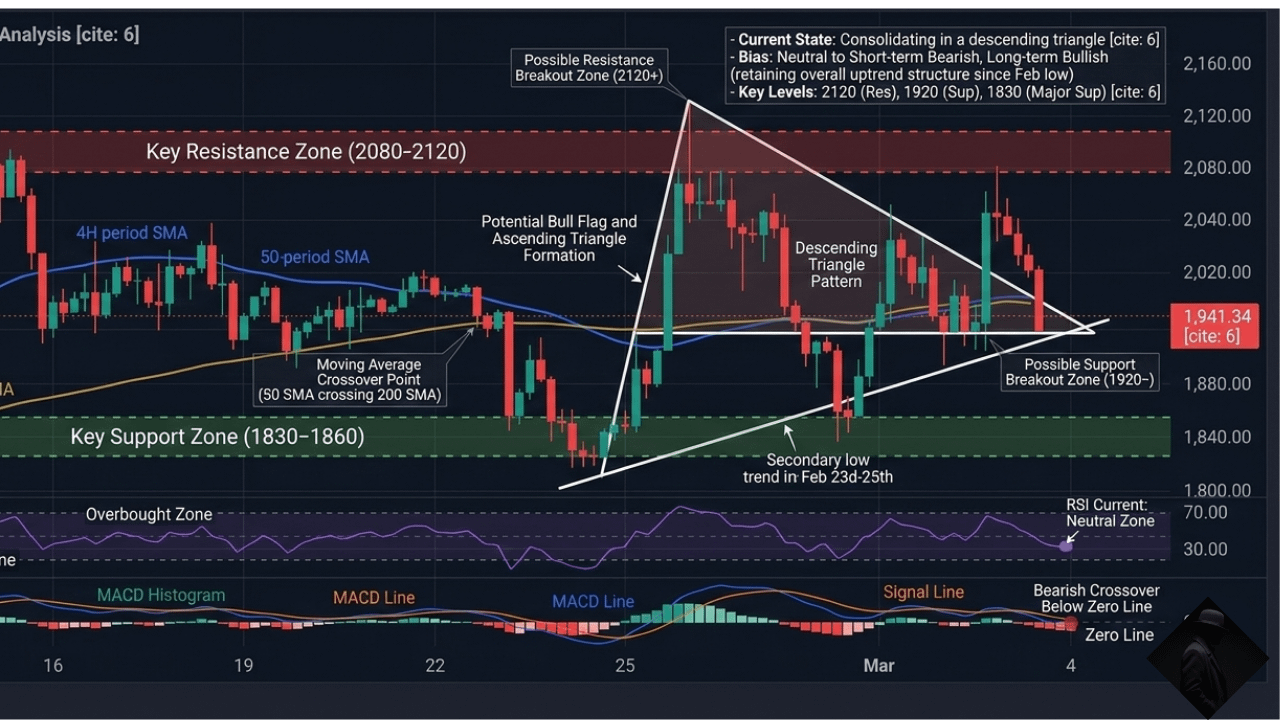
Price Action: Ethereum $ETH is currently showing a bearish trend on the 4H chart. It recently rejected the $2,090 resistance level and is currently making lower highs. It is hovering near a local support zone around $1,920 - $1,940.
Money Flow (4H): The data shows a Net Inflow of -6,296.40 ETH. Crucially, "Large" orders (Whales) are net sellers (-8,335 ETH), while only small/medium retail traders are buying. This suggests heavy distribution by major players.
Large Inflow: There was a massive spike in large inflows (~40k ETH) to the platform in the last 24 hours. Often, large inflows to an exchange precede a sell-off as whales move assets to liquidate.
Platform Concentration: A sharp drop in concentration occurred around 05:00, indicating that large holders may have moved or split their positions, often a sign of impending volatility or exit.
Ethereum ($ETH /USDT) Trading Signal
Note: This analysis is for educational purposes. Trading cryptocurrency involves significant risk.
Signal Direction: SHORT (Sell) 📉
The bias is bearish due to whale selling pressure and the failure to hold the $2,000 level.
Parameter Level/Price
Entry Zone $1,940 — $1,960 (Look for a minor bounce to enter)
Target 1 (TP1). $1,880 (Local psychological support)
Target 2 (TP2) $1,835 (Major 4H support level)
Stop Loss (SL) $2,035 (Above the recent swing high)

Key Observations to Watch:
Support Breakdown: If the price closes a 4H candle below $1,920, the bearish momentum is likely to accelerate quickly toward $1,835.
Volume Check: Keep an eye on the volume; the recent red bars are taller than the green ones, confirming that sellers are currently in control of the 4H timeframe.
Invalidation: If $ETH manages to reclaim and hold above $2,000 with strong volume, this bearish thesis is invalidated, and you should exit the short position.
Fallow For more Crypto Updates & Trading Signal's