🎓 Flag
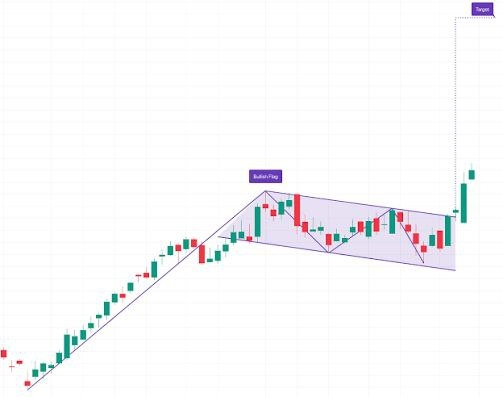
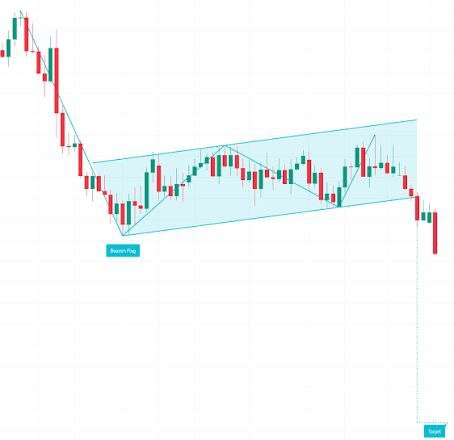
The flag is a graphical continuation pattern.
It appears when the price makes a strong movement (up or down) and then enters a small pause before continuing in the same direction.
It consists of two parts:
• Impulse: initial strong movement.
• Flag: small area where the price moves more slowly.
When the price breaks the flag, often the trend continues. This pattern helps to understand that not every drop is a reversal. Sometimes the market is just resting before continuing.
Impulse → pause → continuation.
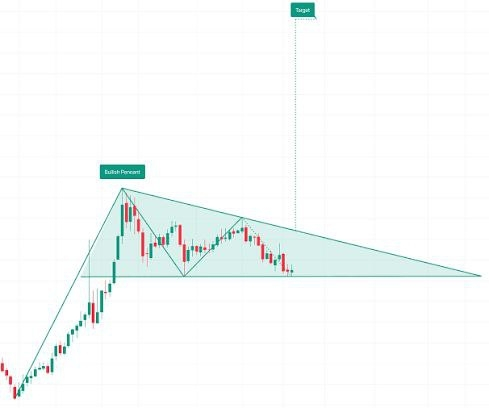
🎓 Pennant
The pennant is a continuation chart pattern.
It appears after a strong price movement and shows a small area where the market compresses before continuing.
It consists of two parts:
• Impulse: strong initial movement.
• Pennant: the price moves in an ever-smaller space forming a small triangle.
When the price breaks the pennant, it often continues in the same direction. This pattern shows that when the price compresses, it is normally preparing to move again.
Impulse → compression → continuation.
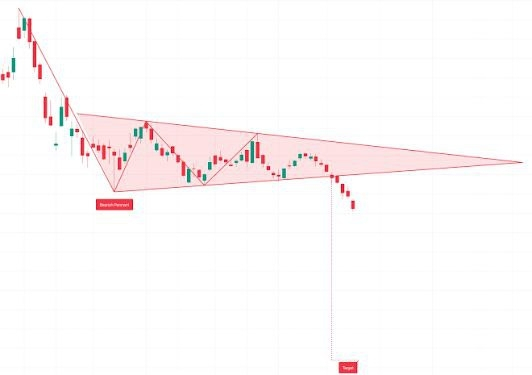
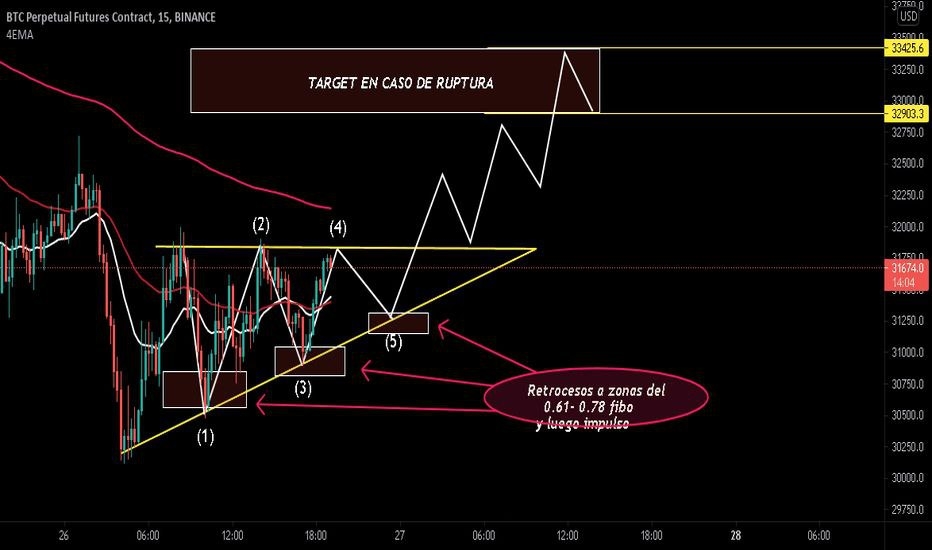
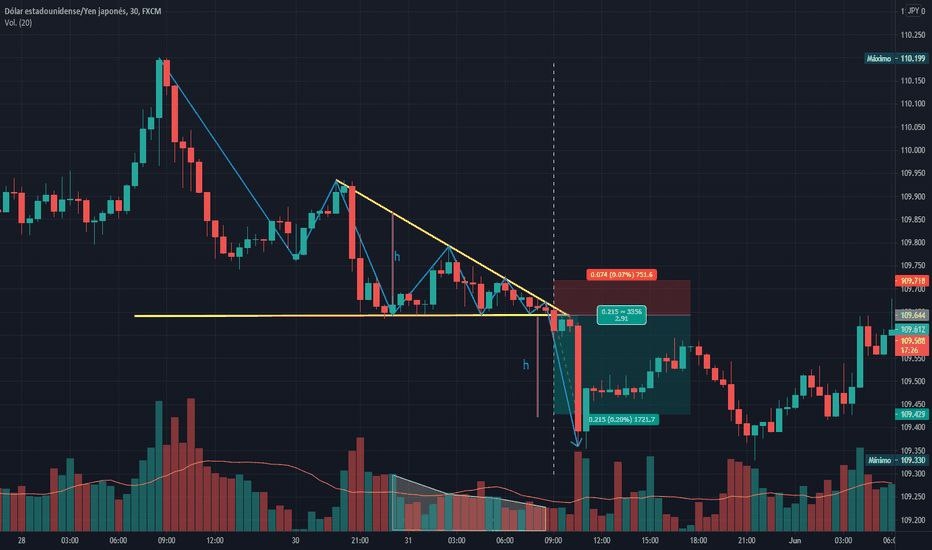
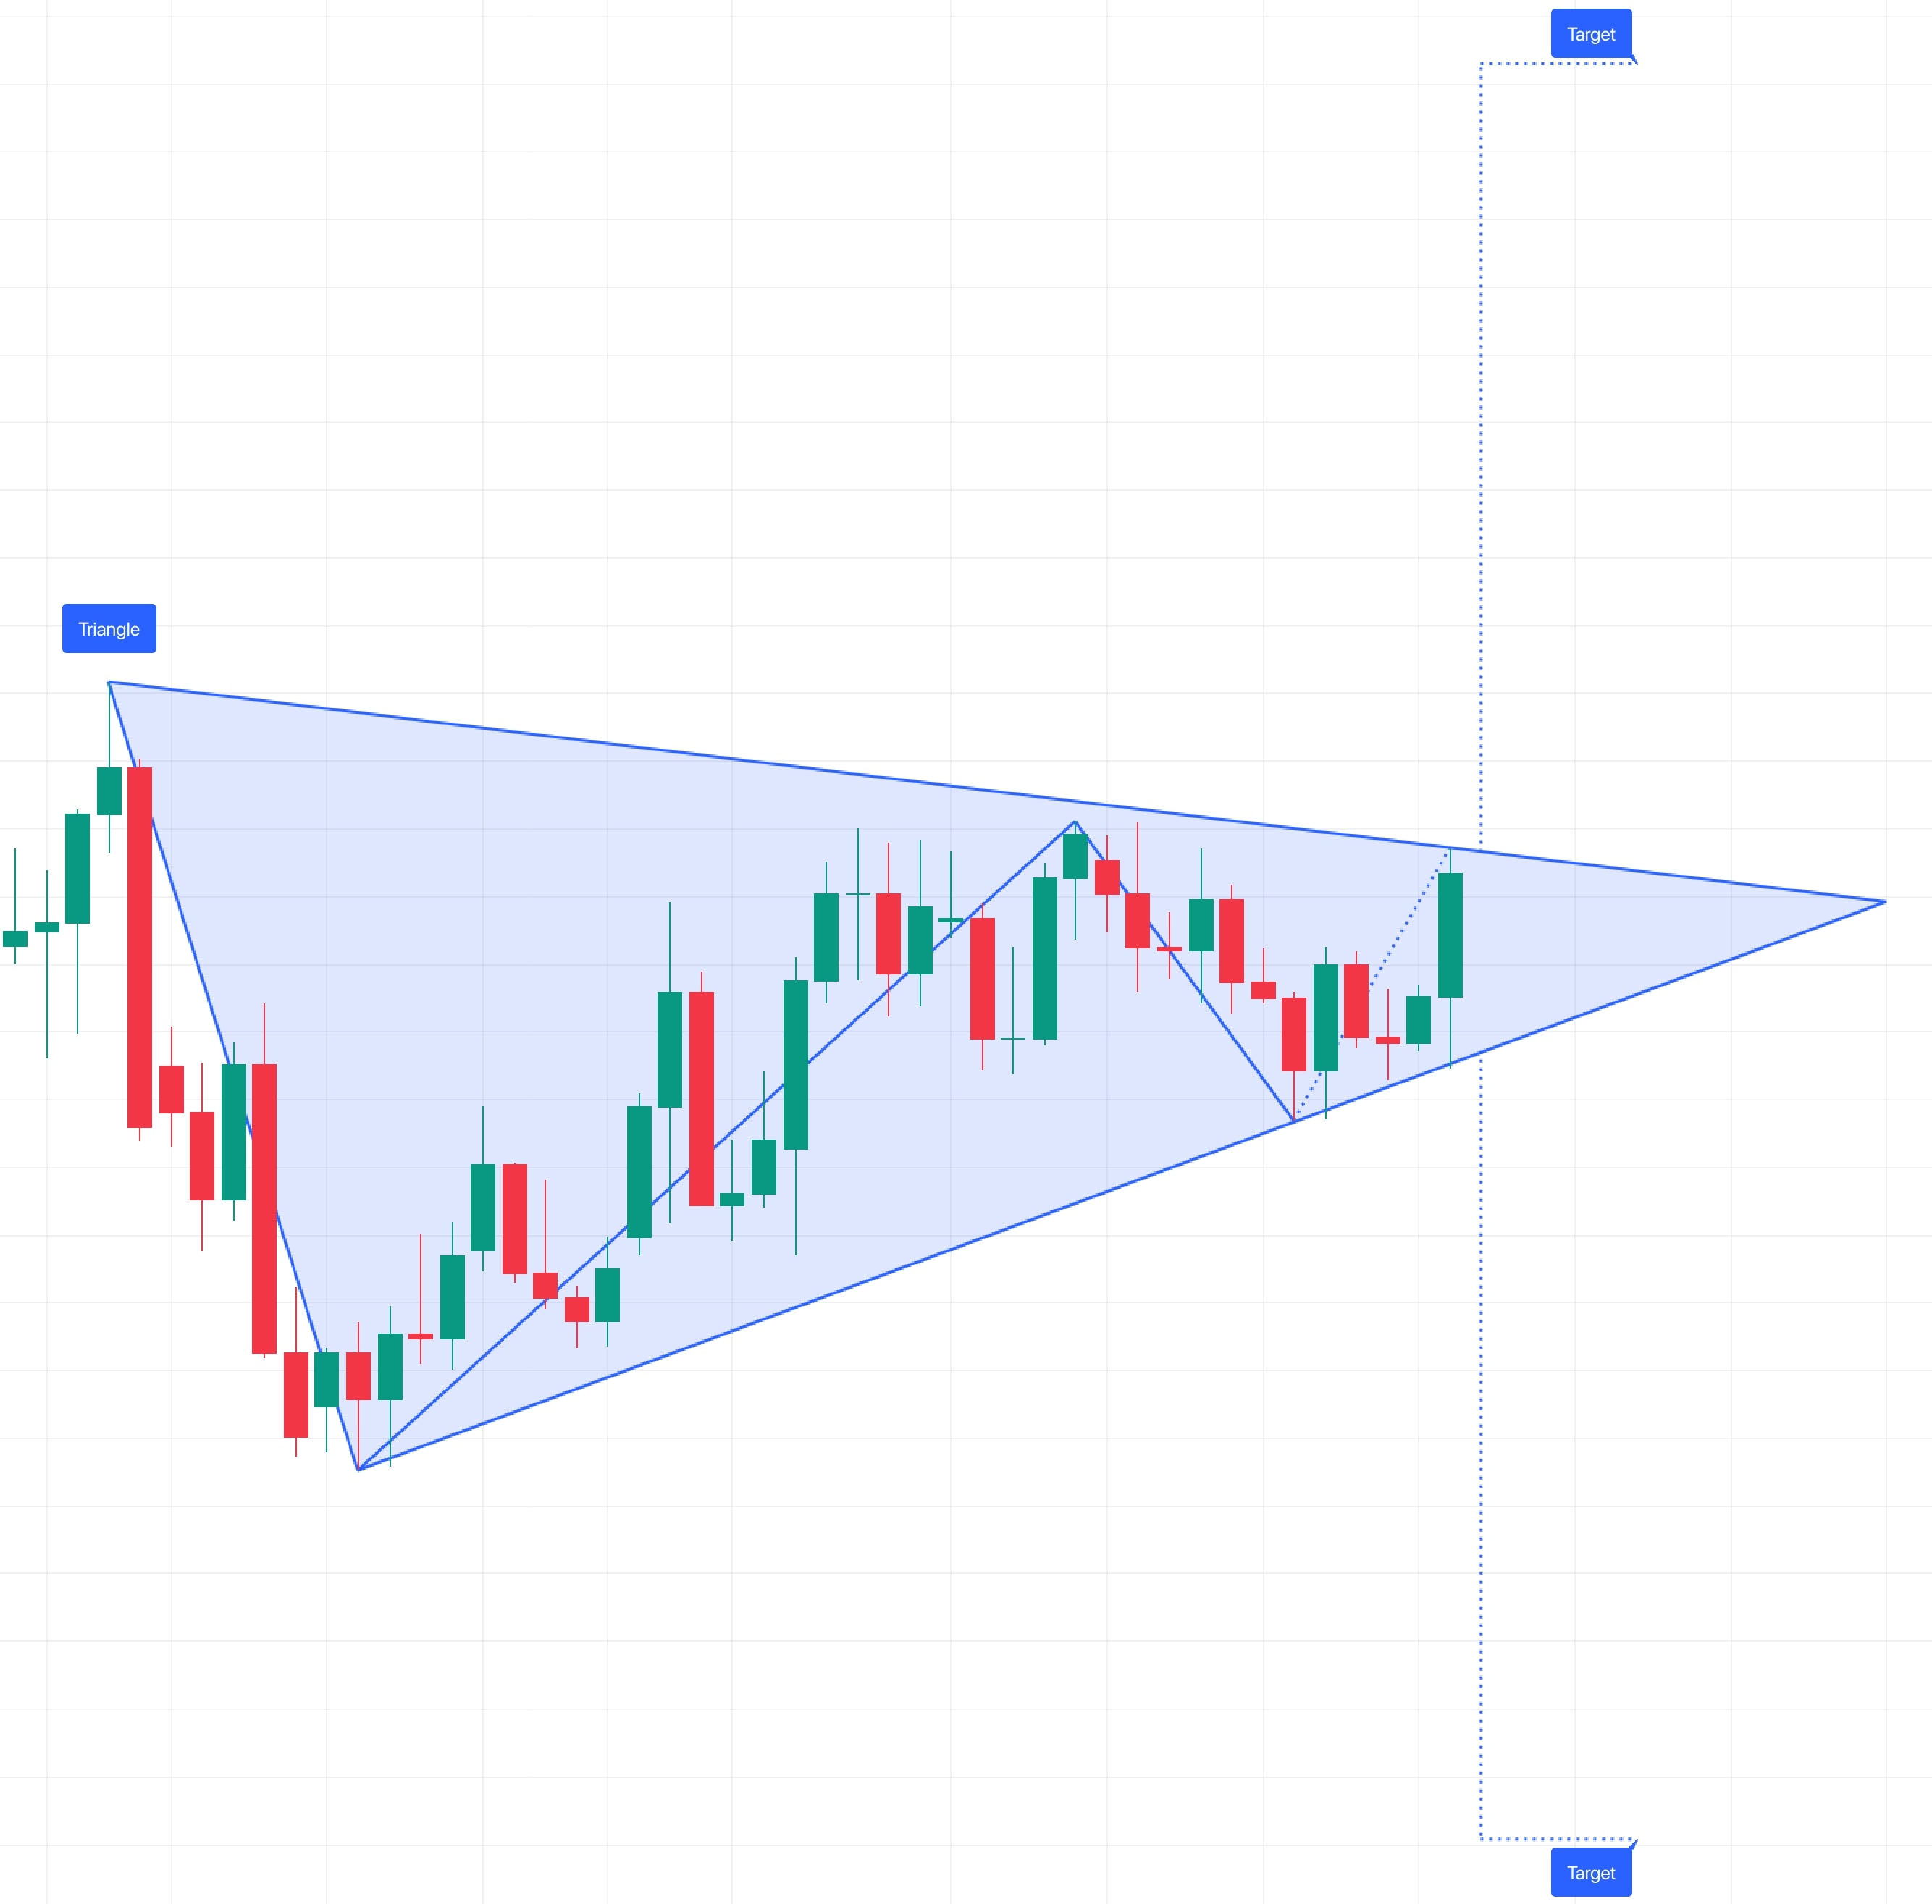
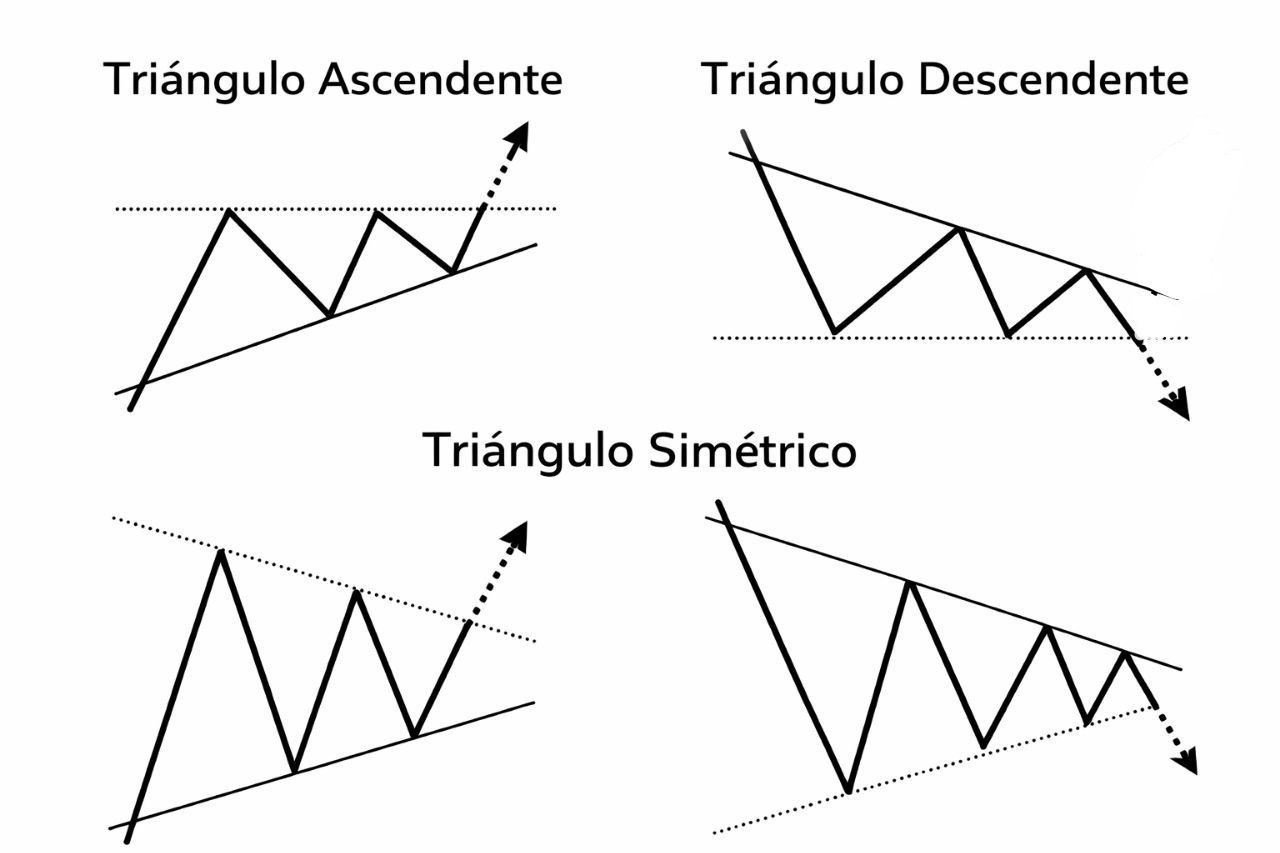
🎓 Triangles
Triangles are chart patterns that appear when the price starts to move in an ever-smaller space.
This happens because buyers and sellers are fighting for price control. Over time, the movement becomes narrower until the price eventually breaks in one direction.
The most common types are:
• Ascending triangle: the top part is almost straight and the bottom part rises.
Usually shows buying pressure and often breaks upwards.
• Descending triangle: the bottom part is almost straight and the top part descends.
Usually shows selling pressure and often breaks downwards.
• Symmetrical triangle: the two lines converge.
Here the price can break in any direction.
Triangles teach that when the price compresses too much, a stronger movement is usually approaching. The breakout is the most important part of the pattern.
Compression → breakout → movement.
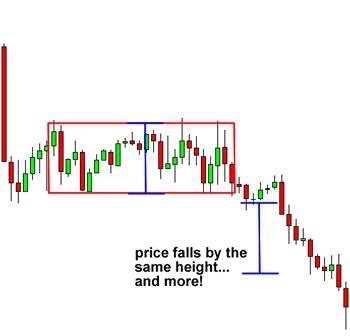
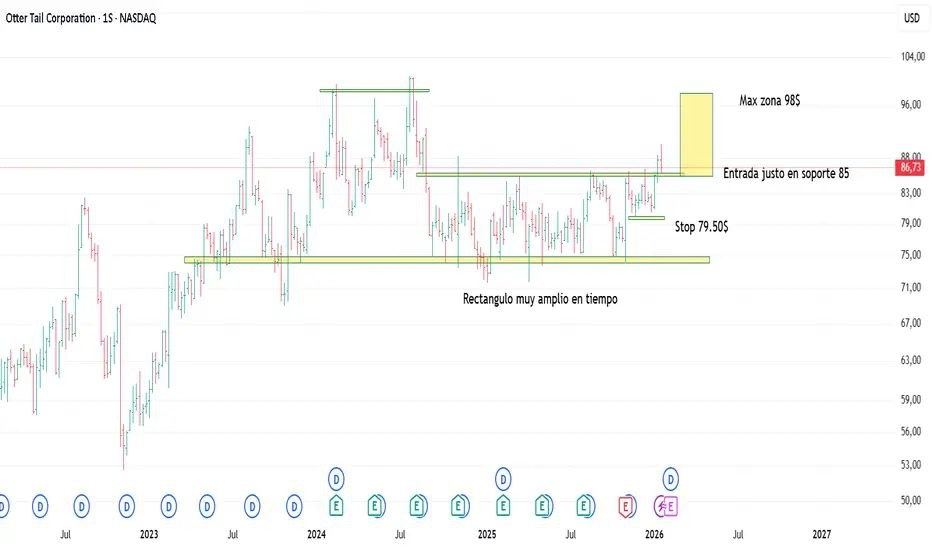
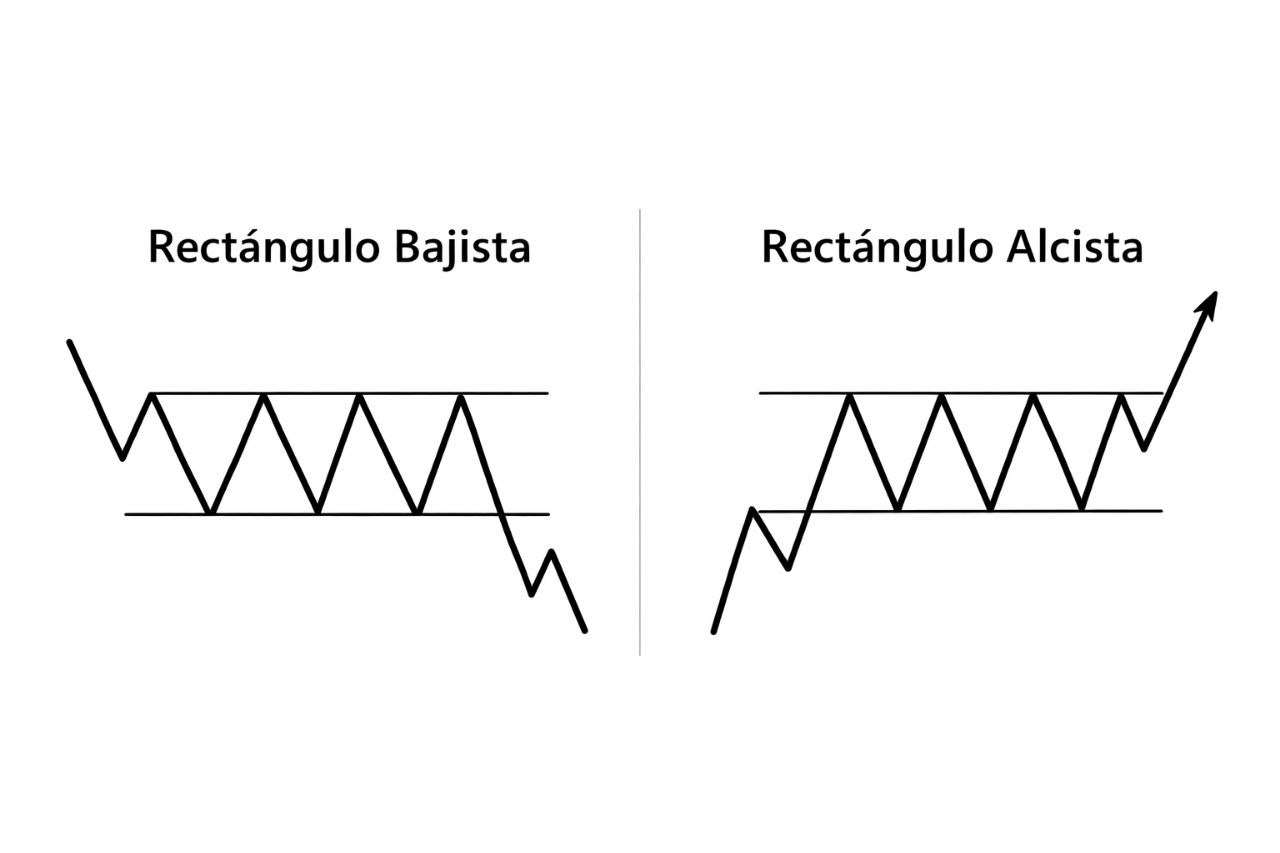
🎓 Rectangle
The rectangle is a chart pattern that appears when the price moves laterally, without a clear trend.
It forms based on price blocks, where the market respects a high zone and a low zone for a time.
The price bounces several times between two levels:
• Support: area where the price usually stops falling.
• Resistance: area where the price usually stops rising.
These blocks show areas where buyers and sellers exchange positions.
The rectangle ends when the price breaks one of those blocks.
If it breaks upwards, the price usually continues to rise.
If it breaks downwards, the price usually continues to fall.
Balance → breakout → direction.
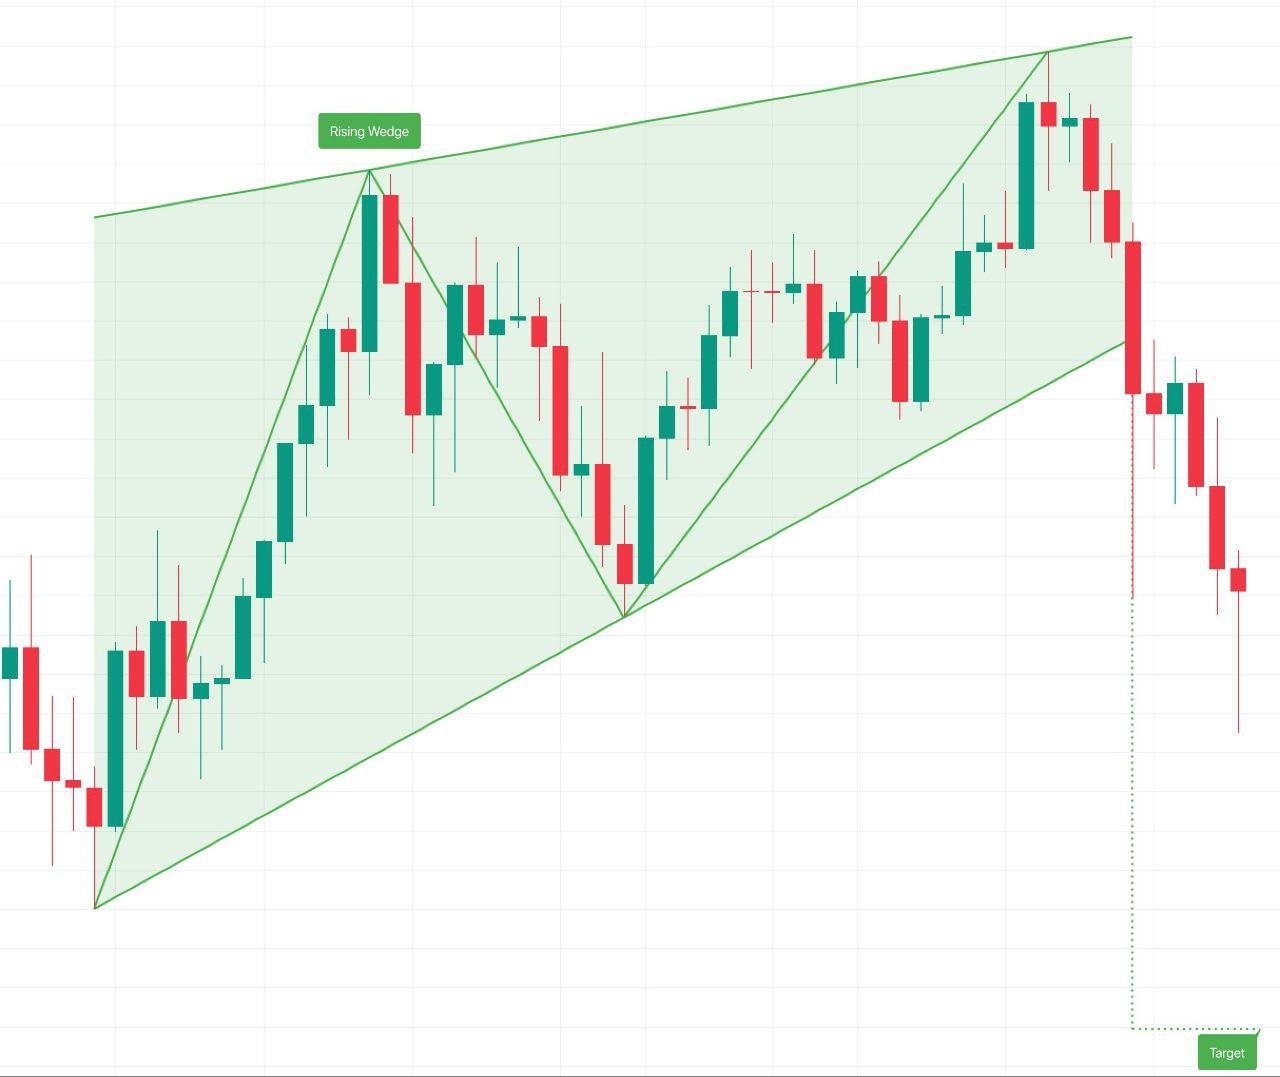
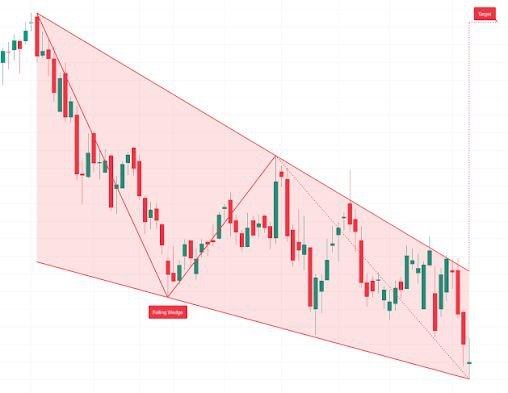
🎓 WEDGES
Wedges are structures where the price compresses between two lines that converge.
They form when the market loses momentum and starts to move in an ever-smaller space. It is a structure based on movement blocks, where each impulse is shorter than the previous one.
The price no longer advances freely, it runs out of space.
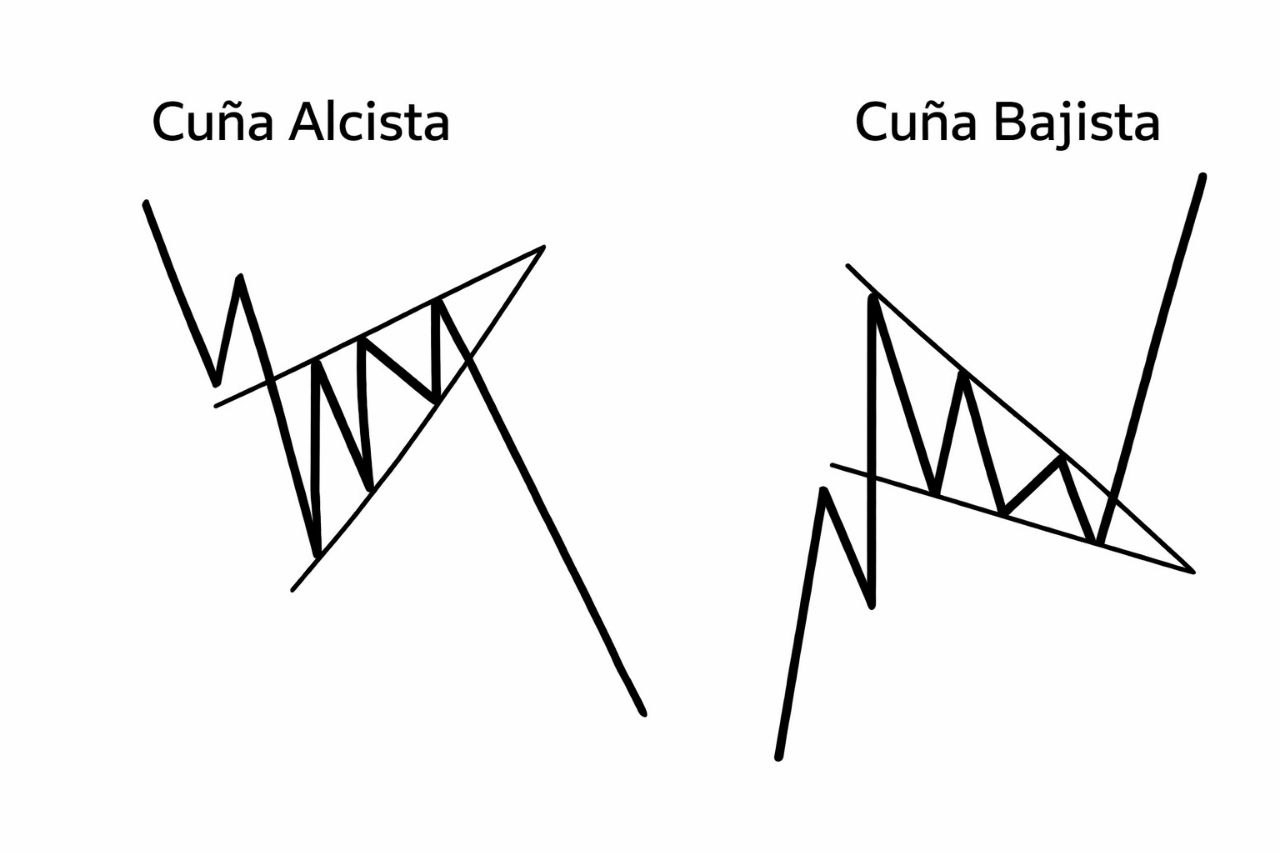
Basic types
• Descending wedge
Bearish blocks getting weaker.
Usually breaks upwards.
• Ascending wedge
Bullish blocks getting weaker.
Usually breaks downwards.
What to observe?
→ Blocks getting shorter
→ Maxima and minima approaching
→ Loss of strength
→ Price compression
Key idea
→ Don't trade in the middle
→ Wait for the breakout
→ The last block usually anticipates the breakout
→ The strong movement appears after
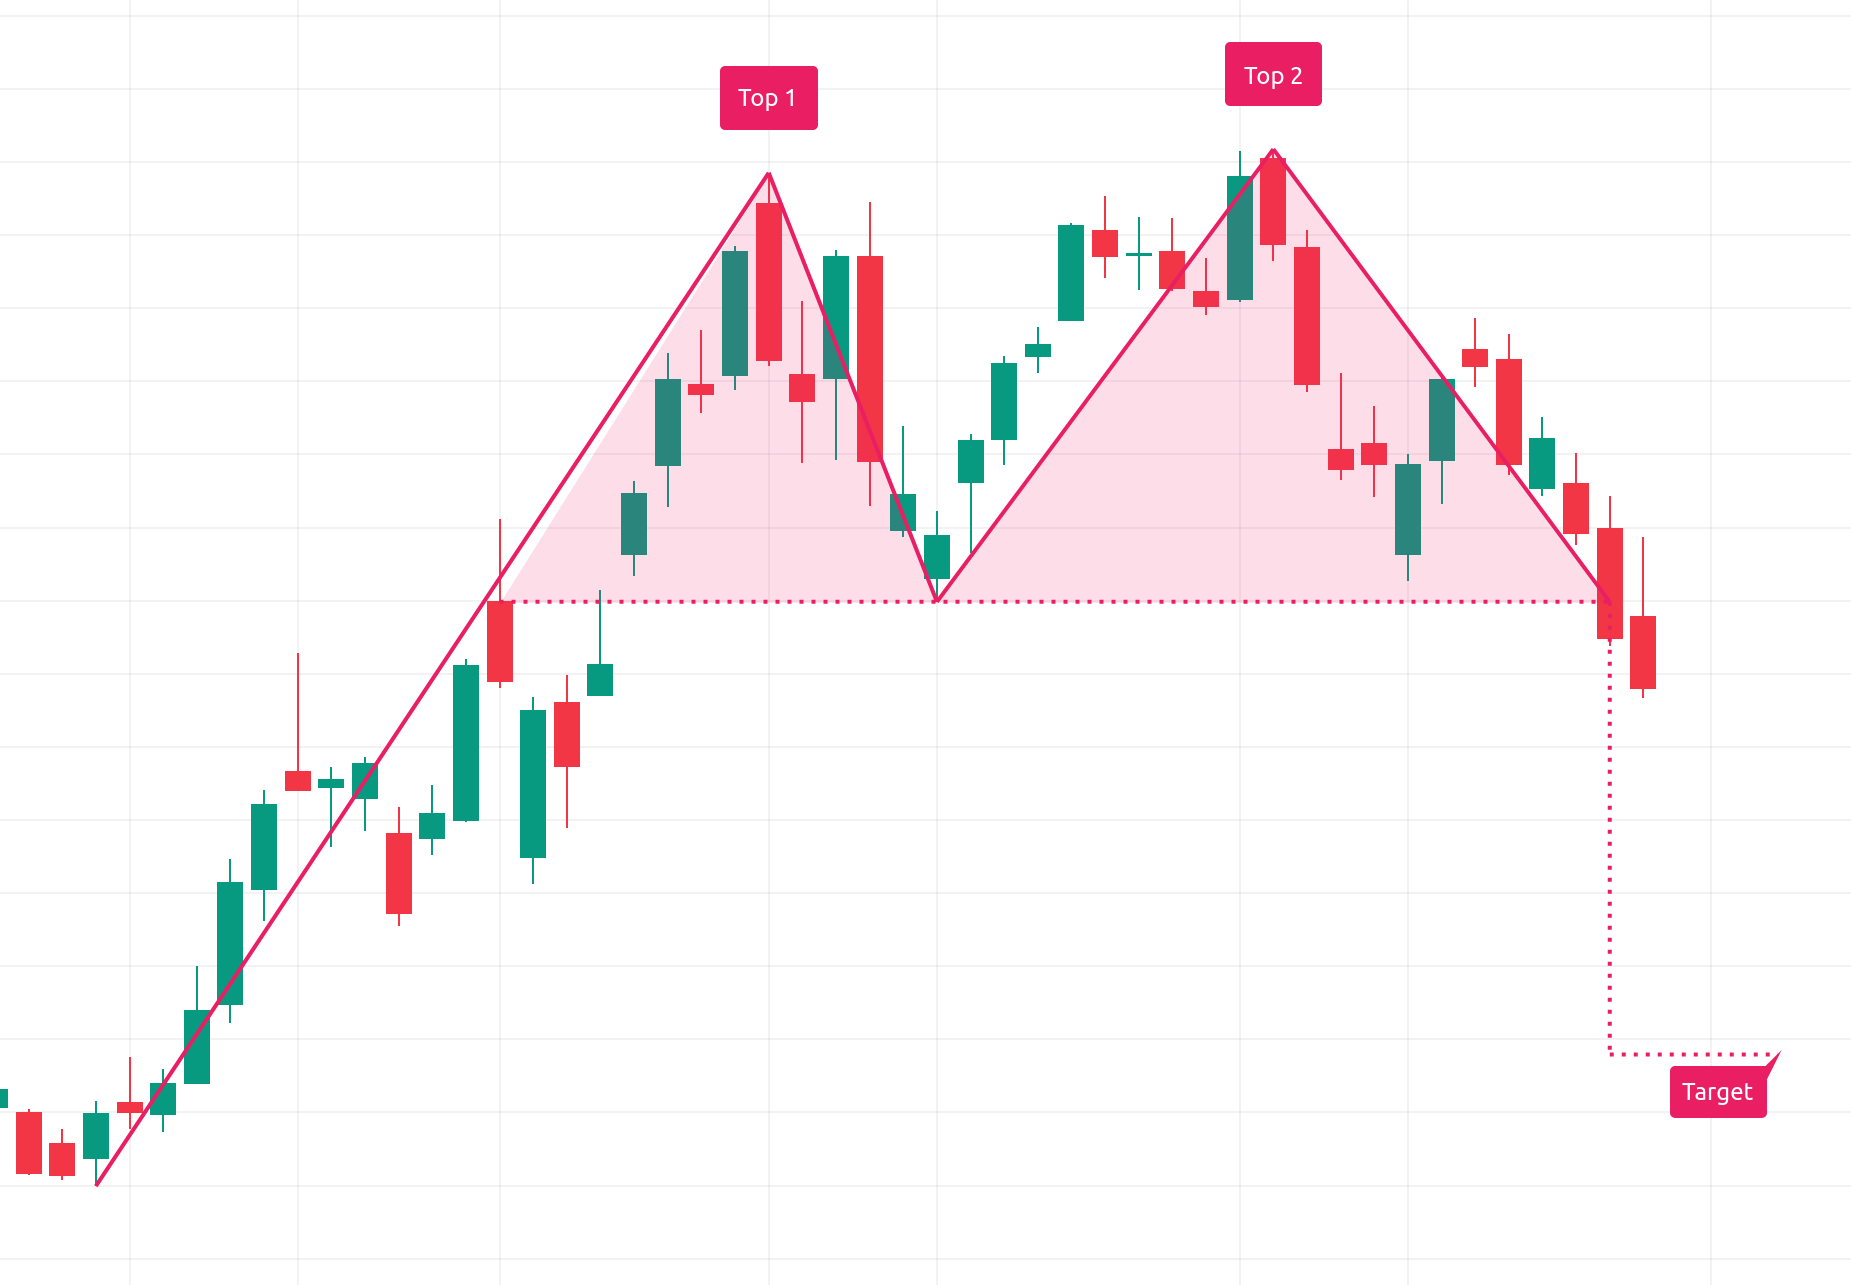
🎓 DOUBLE TOP AND DOUBLE BOTTOM
The double top and double bottom are reversal patterns.
It means that the price tried to break a zone twice and couldn't. It is a structure based on movement blocks:
Rises → stops → corrects → tries again.
If it fails again, the market usually changes direction.
Basic types
• Double top
The price rises twice to the same area.
Shows buying weakness.
Usually anticipates a drop.
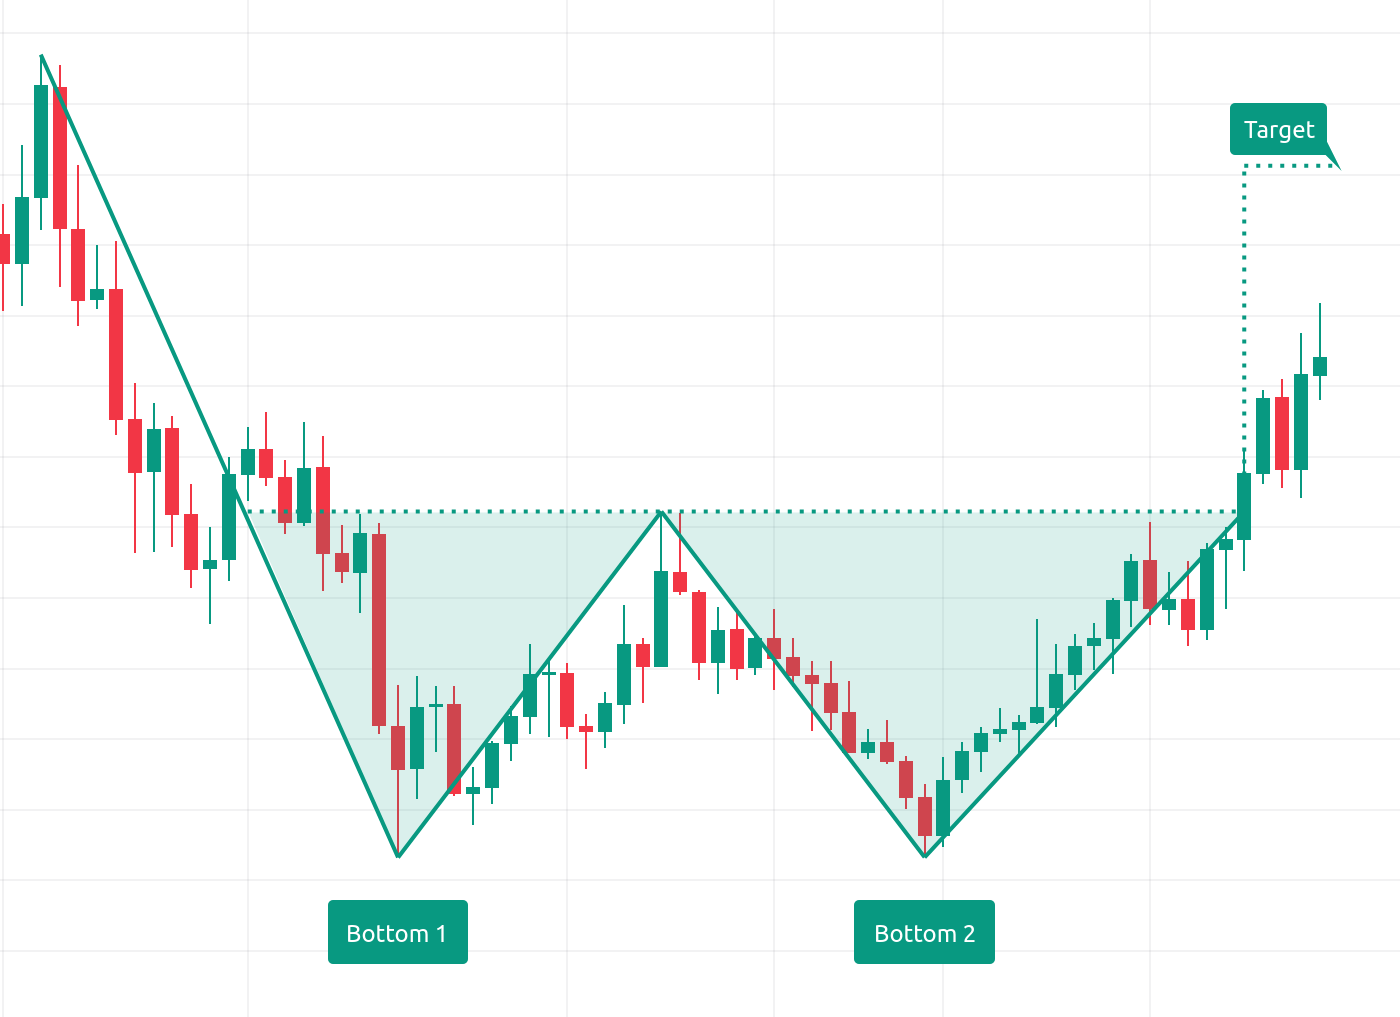
• Double bottom
The price falls twice to the same area.
Shows selling weakness.
Usually anticipates a rise.
What to observe?
→ Two clear attempts in the same area
→ Similar blocks
→ Visible rejections
→ Marked area
Key idea
→ It's not the touch that's important
→ It's the rejection
→ Confirmation usually comes when the price breaks the intermediate level
🎓 TRIPLE TOP AND TRIPLE BOTTOM
The triple top and triple bottom are reversal patterns.
It means that the price tried to break a zone three times and couldn't. It is a structure based on movement blocks:
Rises → corrects → rises → corrects → rises.
When the market fails several times at the same level, it usually loses strength and changes direction.
Basic types
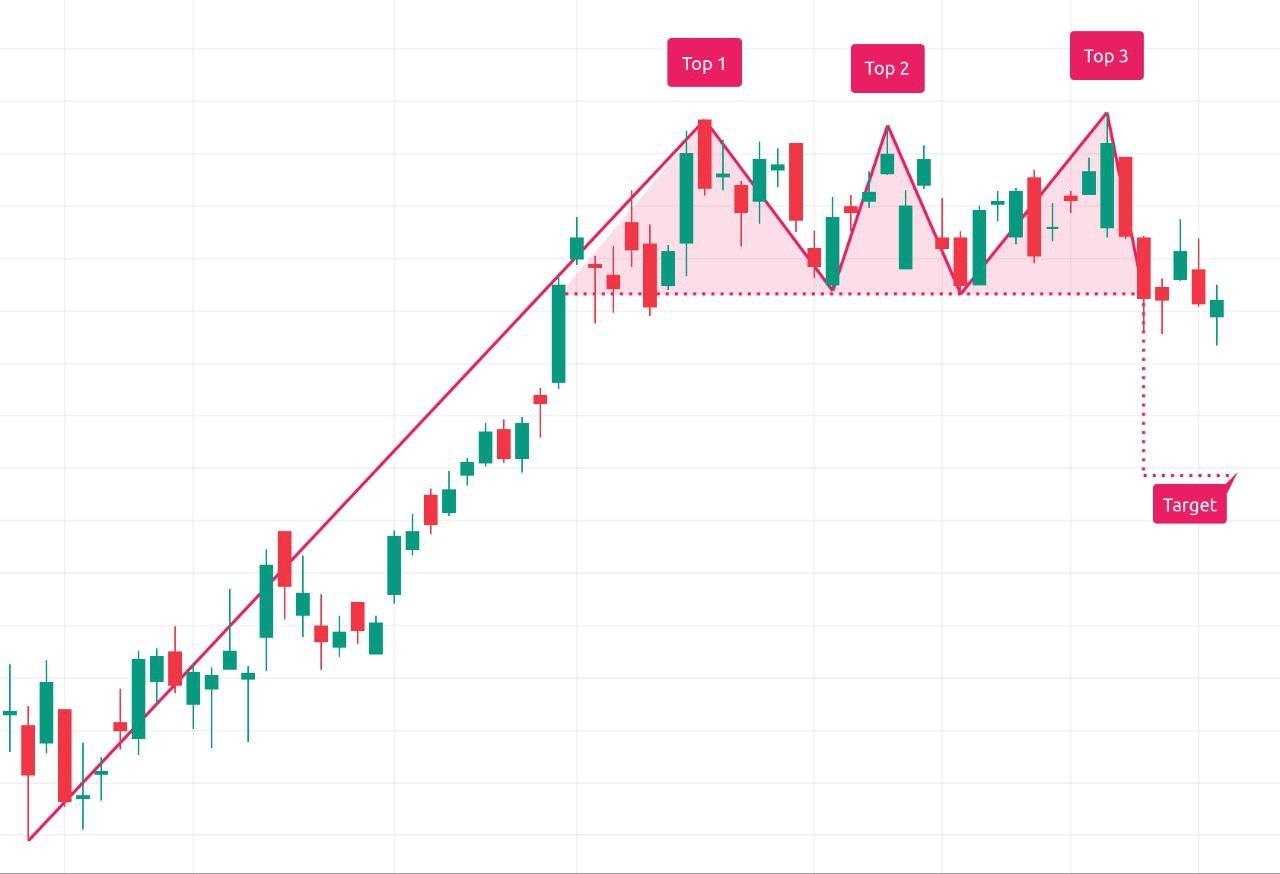
• Triple top
The price rises three times to the same area.
Shows buying weakness.
Usually anticipates a drop.
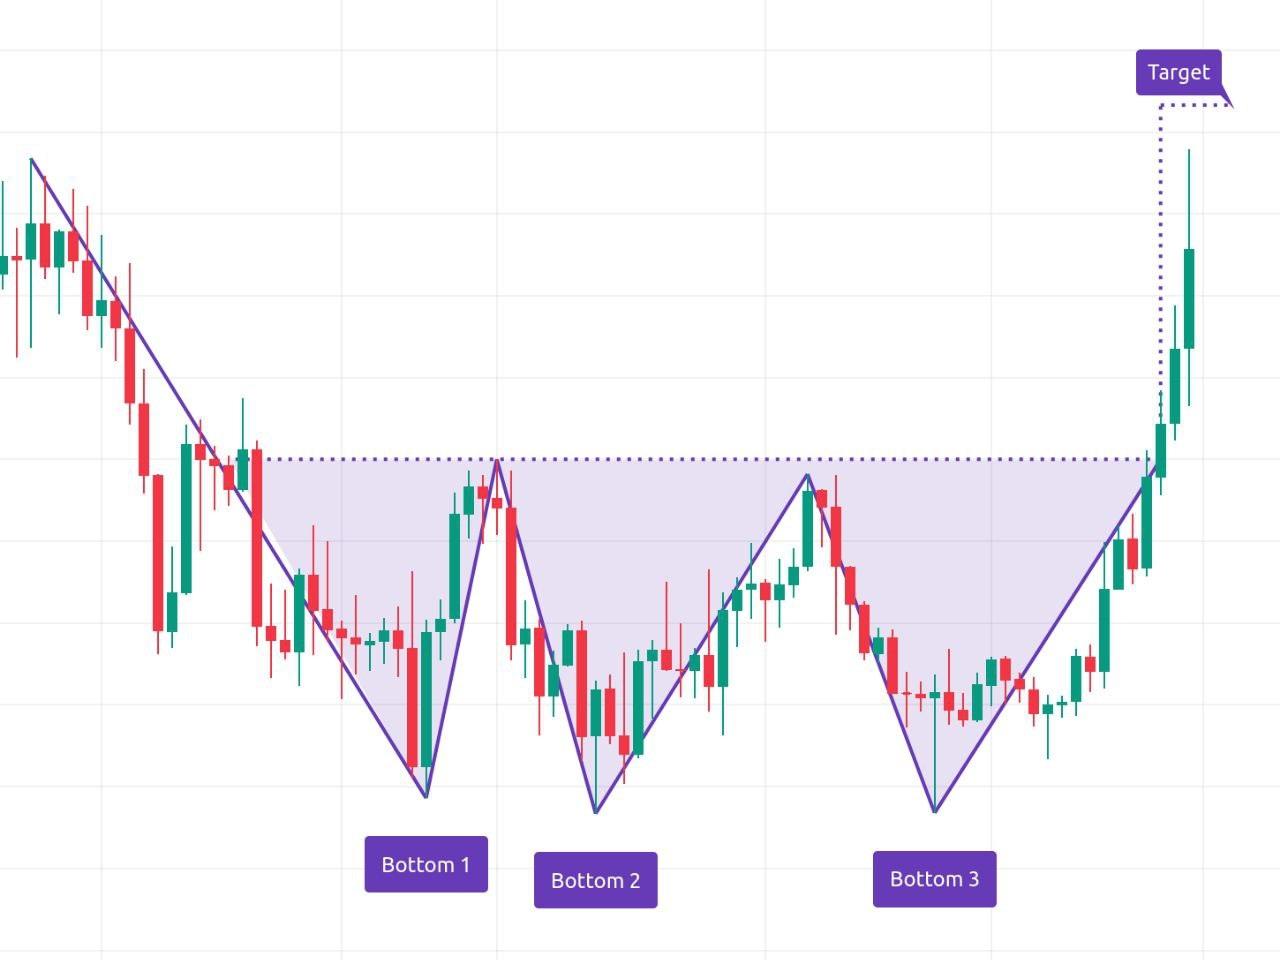
• Triple bottom
The price falls three times to the same area.
Shows selling weakness.
Usually anticipates a rise.
What to observe?
→ Three attempts in the same area
→ Clear blocks
→ Visible rejections
→ Marked area
Key idea
→ More attempts = stronger zone
→ It doesn't matter if it's perfect
→ What matters is that the level is respected
Confirmation
→ It usually appears when the price breaks the intermediate level
→ There the pattern is validated
🎓 HCH (HEAD AND SHOULDERS)
The Head and Shoulders (HCH) is a reversal pattern.
It means that the market was rising, but it starts to lose strength. It is a structure based on movement blocks:
Rises → corrects → rises more → corrects → rises less.
This shows that buyers are losing strength.
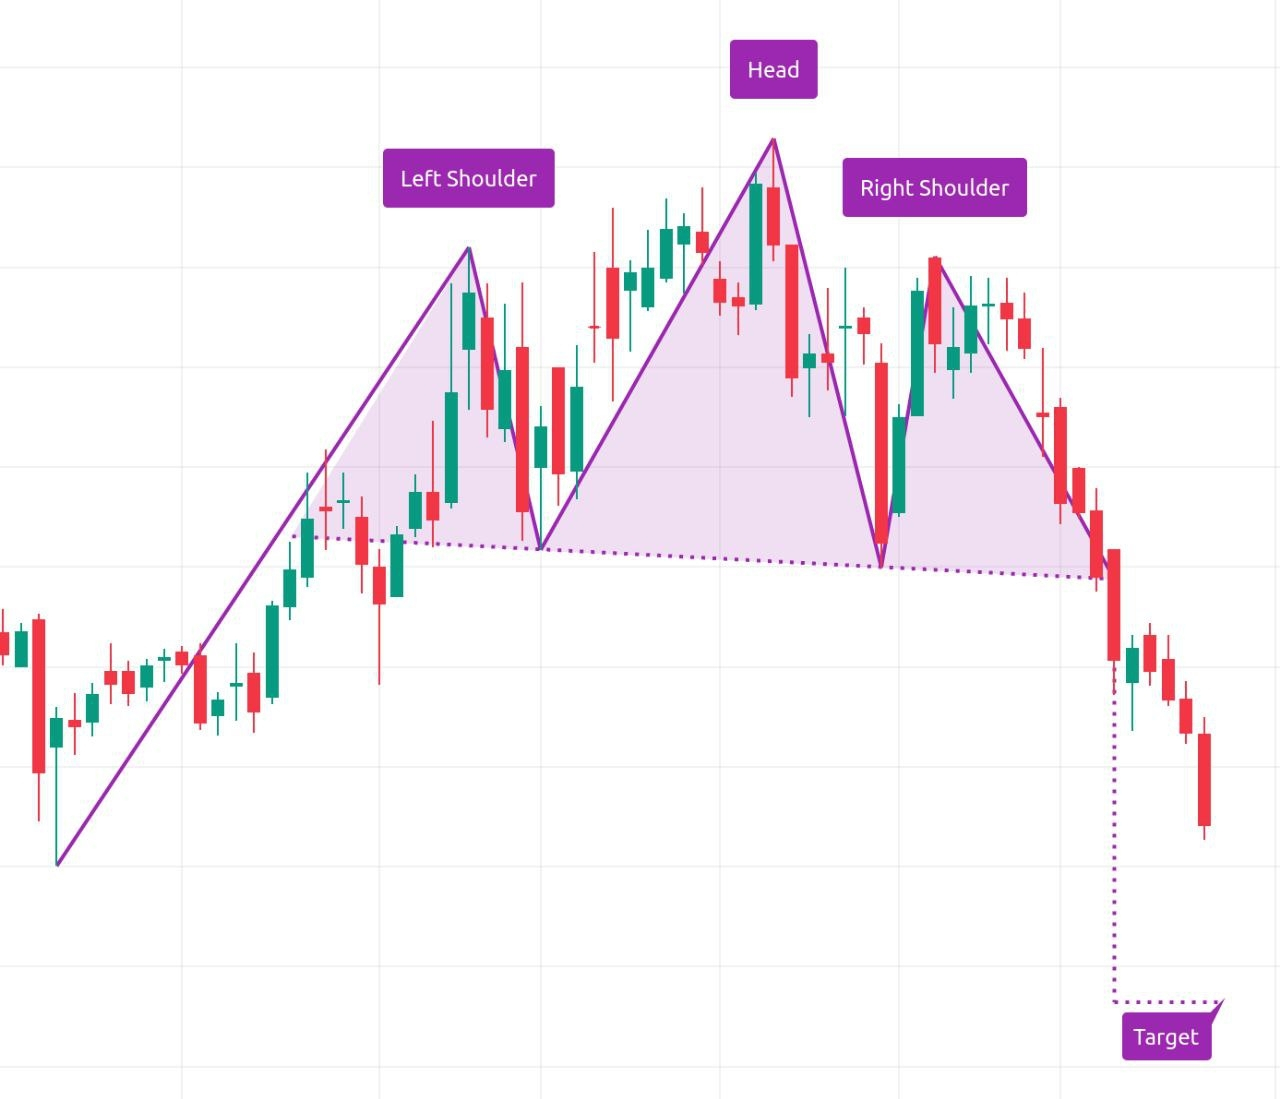
Parts of the pattern
• First shoulder
First rise attempt.
• Head
Second attempt that goes higher.
• Second shoulder
Third attempt that no longer manages to rise equally.
• Neckline
Zone where the price bounces between each rise.
What to observe?
→ Three clear rises
→ The highest head
→ Similar shoulders
→ Visible neckline
Key idea
→ It's not HCH until it breaks the neckline
→ Before breaking, it's just a possibility
Confirmation
→ The pattern is confirmed when the price breaks the neckline
→ After the break, bearish movement usually follows
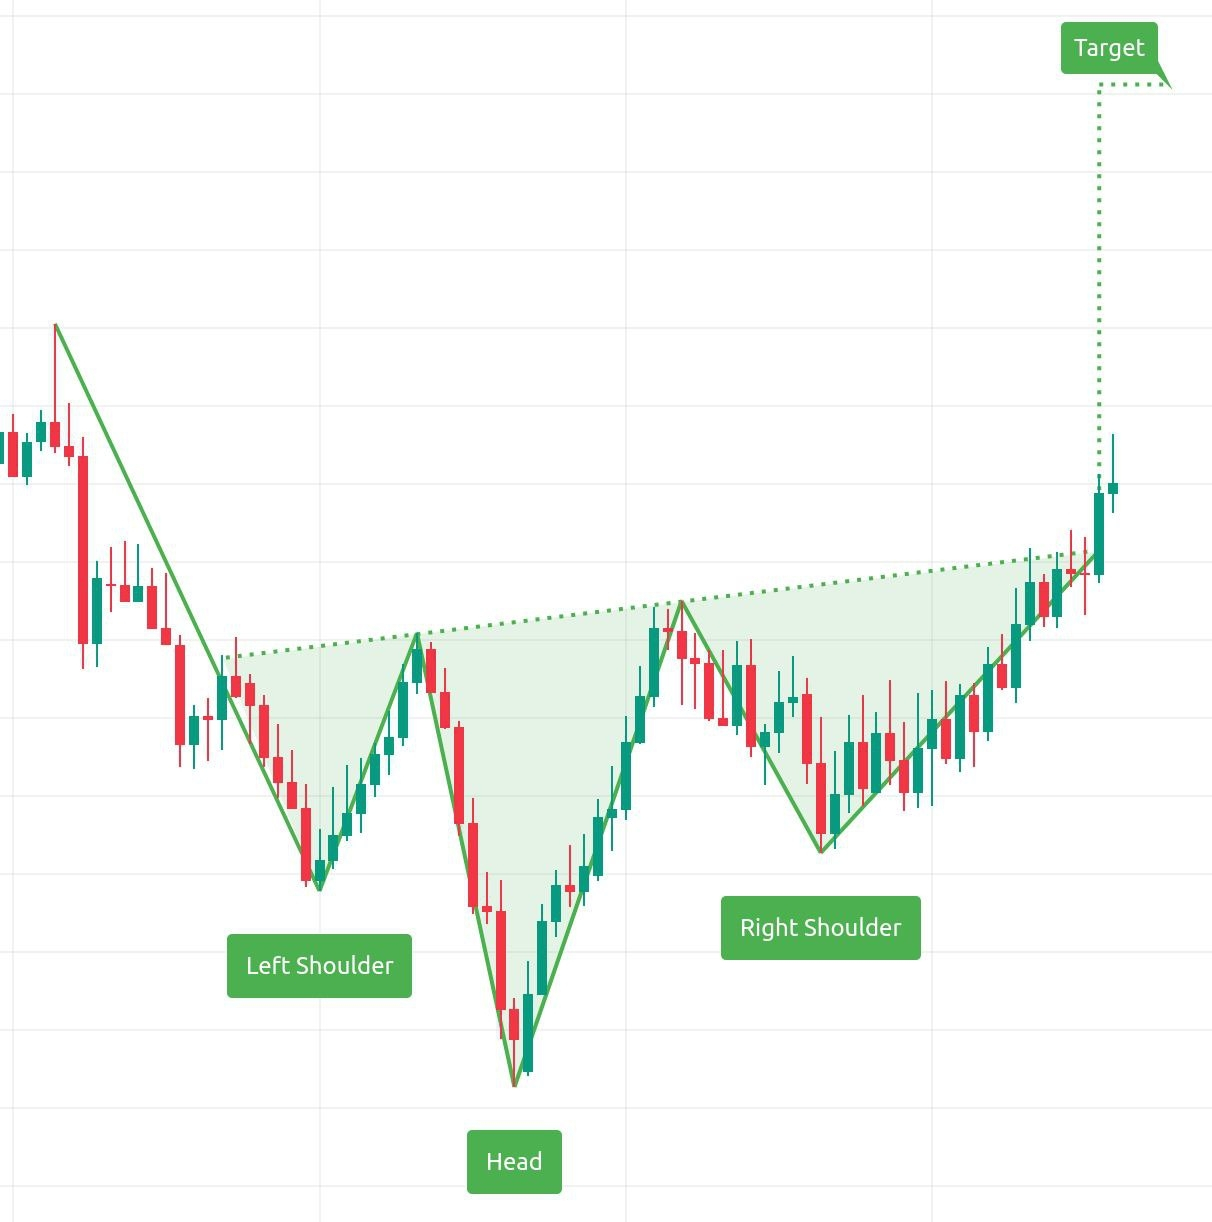
🎓 INVERTED HCH
The Inverted Head and Shoulders is a reversal pattern.
It means that the market was falling, but it starts to lose strength. It is a structure based on movement blocks:
Down → bounces → down more → bounces → down less.
This shows that sellers are losing strength.
Parts of the pattern
• First shoulder
First drop attempt.
• Head
Second drop that goes lower.
• Second shoulder
Third drop that no longer manages to go lower.
• Neckline
Zone where the price bounces between each drop.
What to observe?
→ Three clear drops
→ The lowest head
→ Similar shoulders
→ Visible neckline
Key idea
→ It's not inverted HCH until it breaks the neckline
→ Before breaking, it's just a possibility
Confirmation
→ The pattern is confirmed when the price breaks the neckline
→ After the breakout, bullish movement usually follows 📈