Welcome To #LuckySevenTrader 🔥
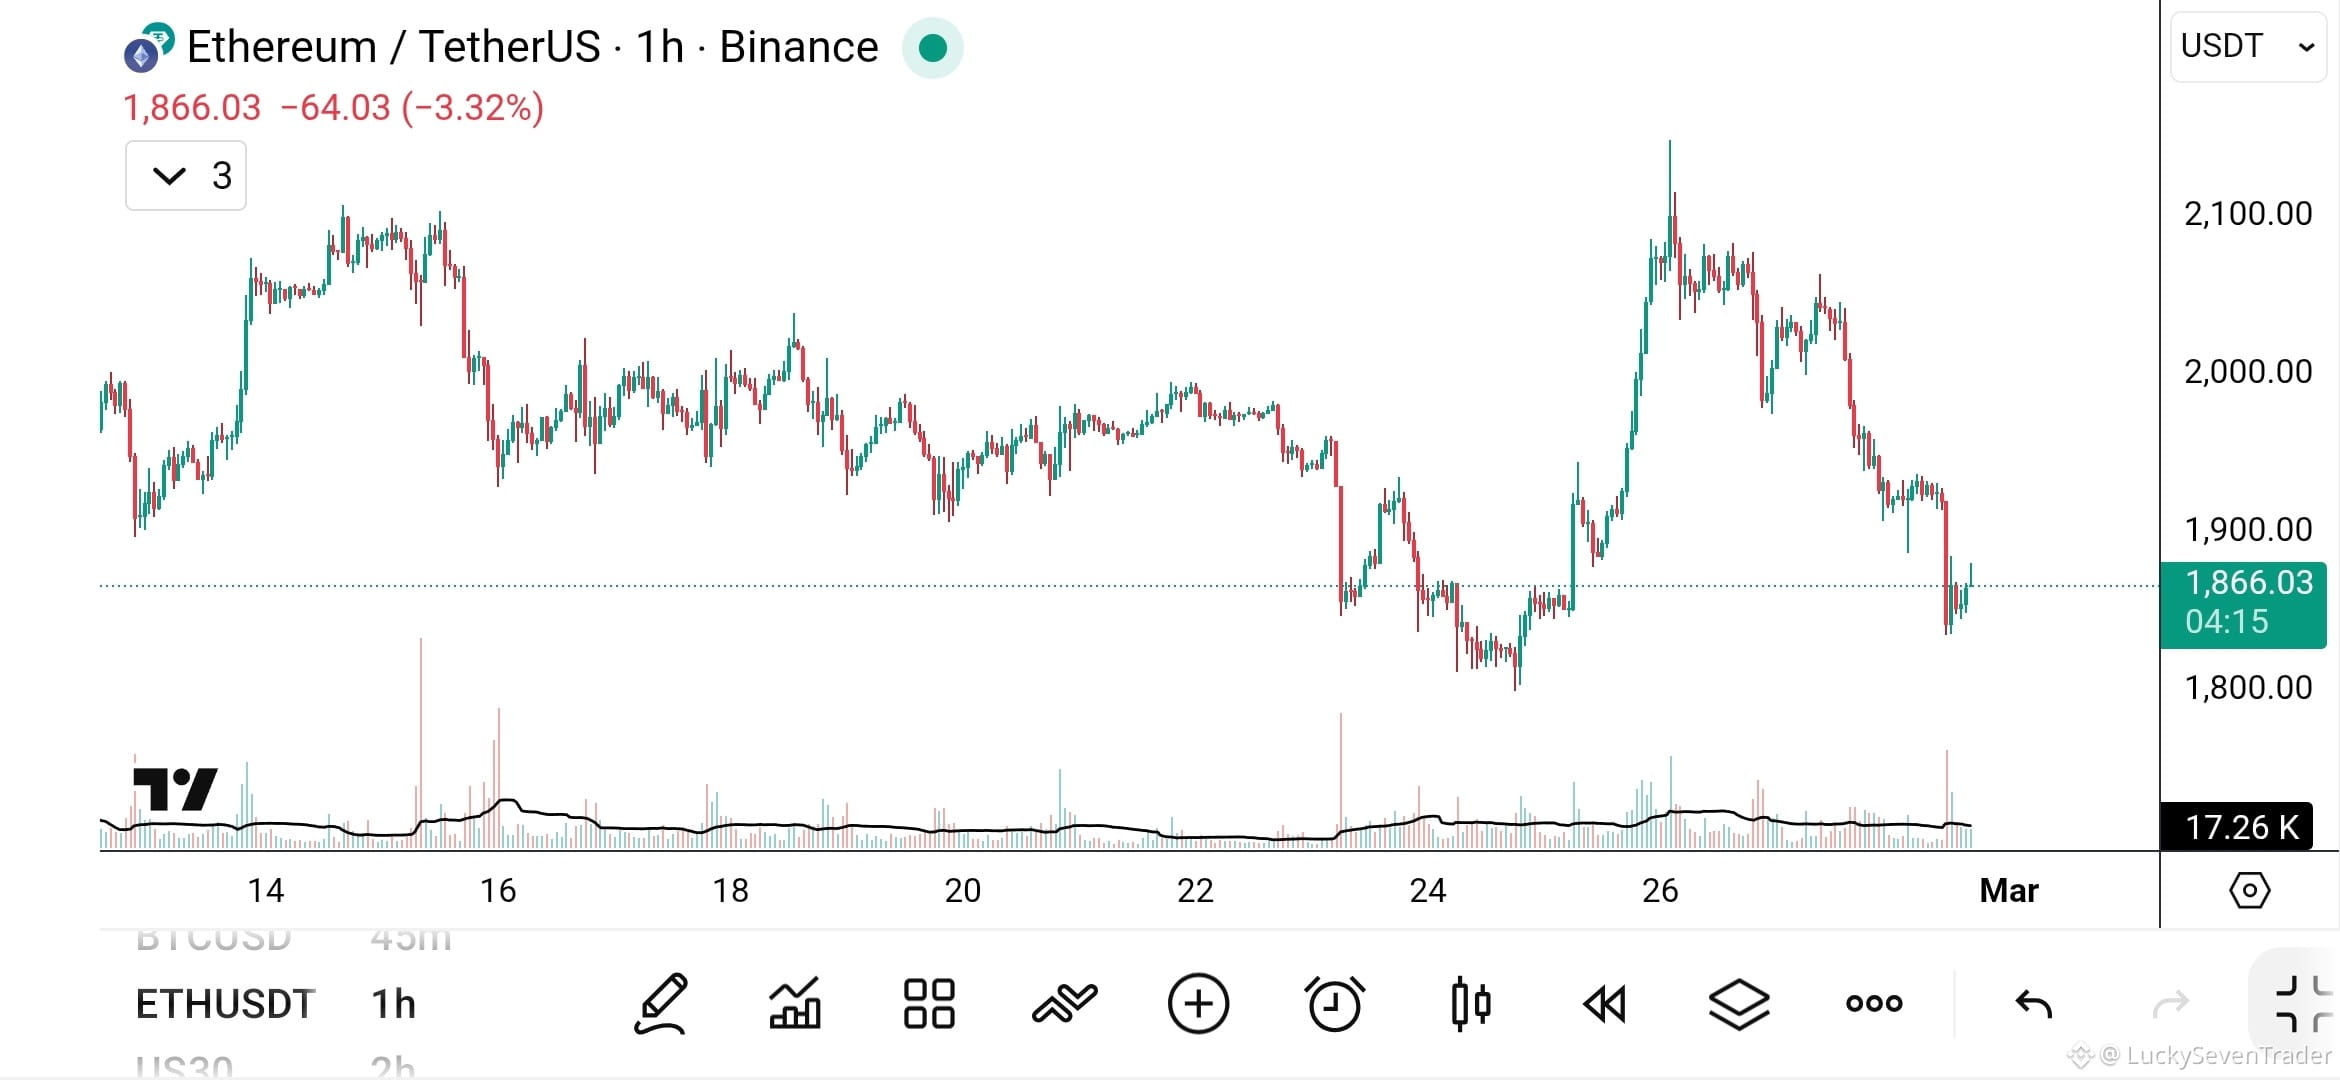
Taking a look at the 1-hour chart of #Ethereum against Tether, the structure is clearly shifting bearish after failing to sustain above the $2,050–$2,100 resistance zone.
🔎 Market Structure Breakdown
Strong rejection from $2,100 area → clear liquidity grab.
Series of lower highs and lower lows forming.
Heavy selling pressure pushed price down toward $1,830–$1,850 demand zone.
Current price (~$1,866) looks like a weak bounce, not a confirmed reversal.
Volume increased during the drop, which signals aggressive selling rather than healthy consolidation.
📌 Trade Setup (Short Bias)
✅ Sell Zone:
$1,880 – $1,920 (supply / breakdown retest area)
🎯 Targets:
TP1: $1,830
TP2: $1,780
TP3: $1,720 (if bearish momentum continues)
🛑 Stop Loss:
Above $1,960
Risk management is key — avoid overleveraging in volatile conditions.
⚠️ Bullish Invalidation
If ETH closes strong above $1,960–$2,000 with high volume on 1H timeframe, then short setup becomes invalid and we may see another push toward $2,050+.
🧠 Final Thought
Right now, the trend favors sellers. Until Ethereum forms a clear higher high and reclaims key resistance levels, rallies are likely selling opportunities.
Trade with discipline. Protect your capital. Follow the trend — not emotions.