#اخبار_الكريبتو_العاجلة #عملات_رقمية #اقتصاد_رقمي #كريبتو #استثمار_رقمي #عملة_SXT #ارباح_الكريبتو #wct $AMZNon
The price of the Memecore token is currently trading at around $1.42, after facing resistance near $1.60 and support near $1.30.
Technical indicators, such as moving averages, the Relative Strength Index (RSI), and the MACD, suggest potential signs of recovery, but the currency is still in a phase of price volatility.
The price of Memecore (M) is experiencing an extended period of stability after a sharp decline from its previous highs. While the global cryptocurrency market remains mixed, technical indicators suggest the possibility of a trend reversal forming on the daily timeframe.
At the time of writing this report, Memecore is trading at around $1.42, with slight fluctuations throughout the day. The currency has moved within a narrow range over the past few weeks, indicating a state of indecision among buyers and sellers.
Recently, Memecore faced resistance near the resistance area at $1.60, which corresponds to the upper limit of its recent trading range. On the downside, immediate support is near $1.28-$1.30, a level that has seen repeated buying pressure.
A decisive breakout above $1.60 could open the way to reach $1.80, potentially pushing the currency towards the psychological resistance level at $2.00. However, if the currency fails to maintain above $1.30, it may face further declines towards the support area at $1.15.
The convergence of price levels indicates the potential for an expansion of volatility, with the market poised for its next big move.
Technical indicators suggest early signs of recovery.
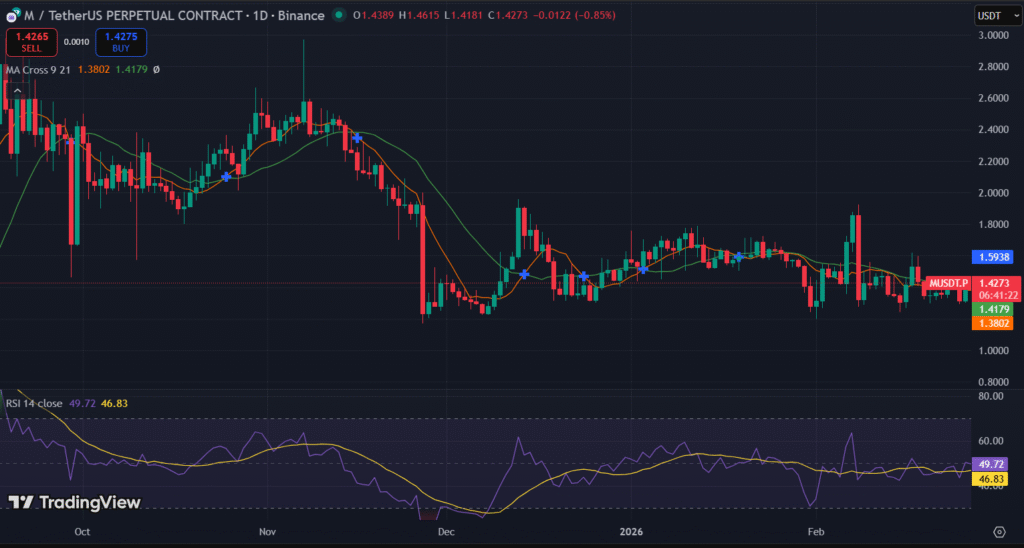
On the daily chart, the 9-day moving average is $1.4179, while the 21-day moving average is $1.3802. It is important to note that the 9-day moving average is above the 21-day moving average, indicating a short-term bullish crossover. This suggests that the market momentum in the near term is trying to shift in favor of buyers after weeks of downward pressure.
The price of the digital currency is currently trading just above both moving averages, suggesting that buyers are trying to take control of the market in the short term. However, maintaining stability above this set of moving averages is crucial to confirm the strength of the trend. If the price closes decisively above the recent swing highs, the bullish alignment of the moving averages may gain further confirmation.
Meanwhile, the Relative Strength Index (14) is at 49.72, while its moving average is 46.83. The fluctuation of the RSI near the midpoint of 50 reflects neutral momentum. It is noteworthy that the RSI has recovered from the oversold area it previously experienced during the downtrend, indicating a decrease in selling pressure. A break above the 55-60 level will reinforce the bullish momentum confirmation.
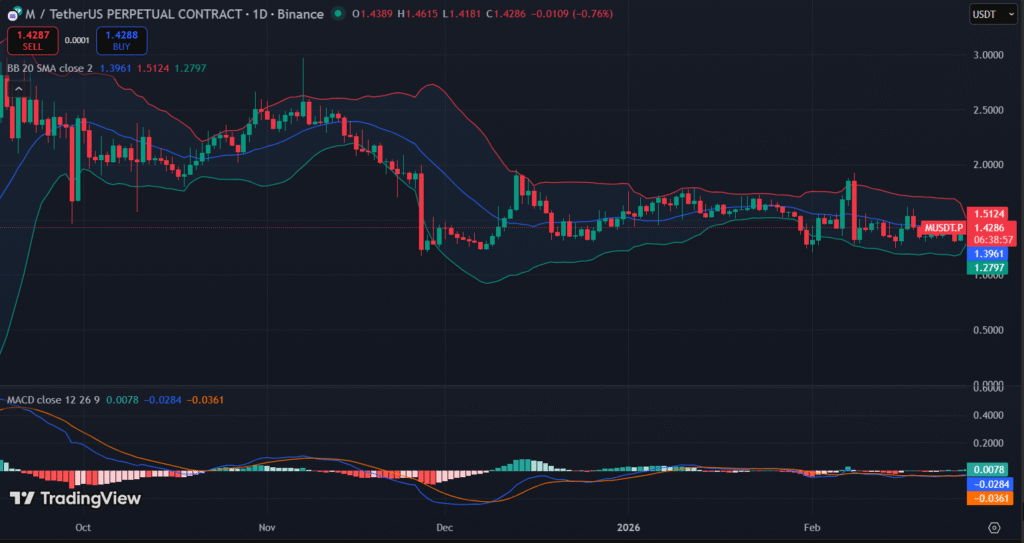
Additionally, the MACD shows early signs of convergence. The histogram is gradually shrinking, indicating weakening downward momentum. A confirmed expansion above the zero line would significantly enhance the likelihood of a reversal.
Upon closer inspection, we notice that the Bollinger Bands are narrowing, indicating a decrease in volatility. With the price stabilizing near the midpoint of the range ($1.3961), Memecore is still in a consolidation phase. A sustained breakout above $1.5124 could lead to bullish expansion, while a drop below $1.2797 could renew downward pressure.
If buying volume increases alongside a breakout of the resistance level, the price of Memecore may transition from a consolidation phase to a recovery phase. The current structure of Memecore indicates price accumulation rather than intense selling. While additional confirmation is needed, momentum indicators are gradually improving.
Currently, the resistance areas at $1.60 and support at $1.30 are significant. A breakout or breakdown of this range is likely to determine the next direction of the currency's movement.$AAPLon