Bitcoin chart forecast
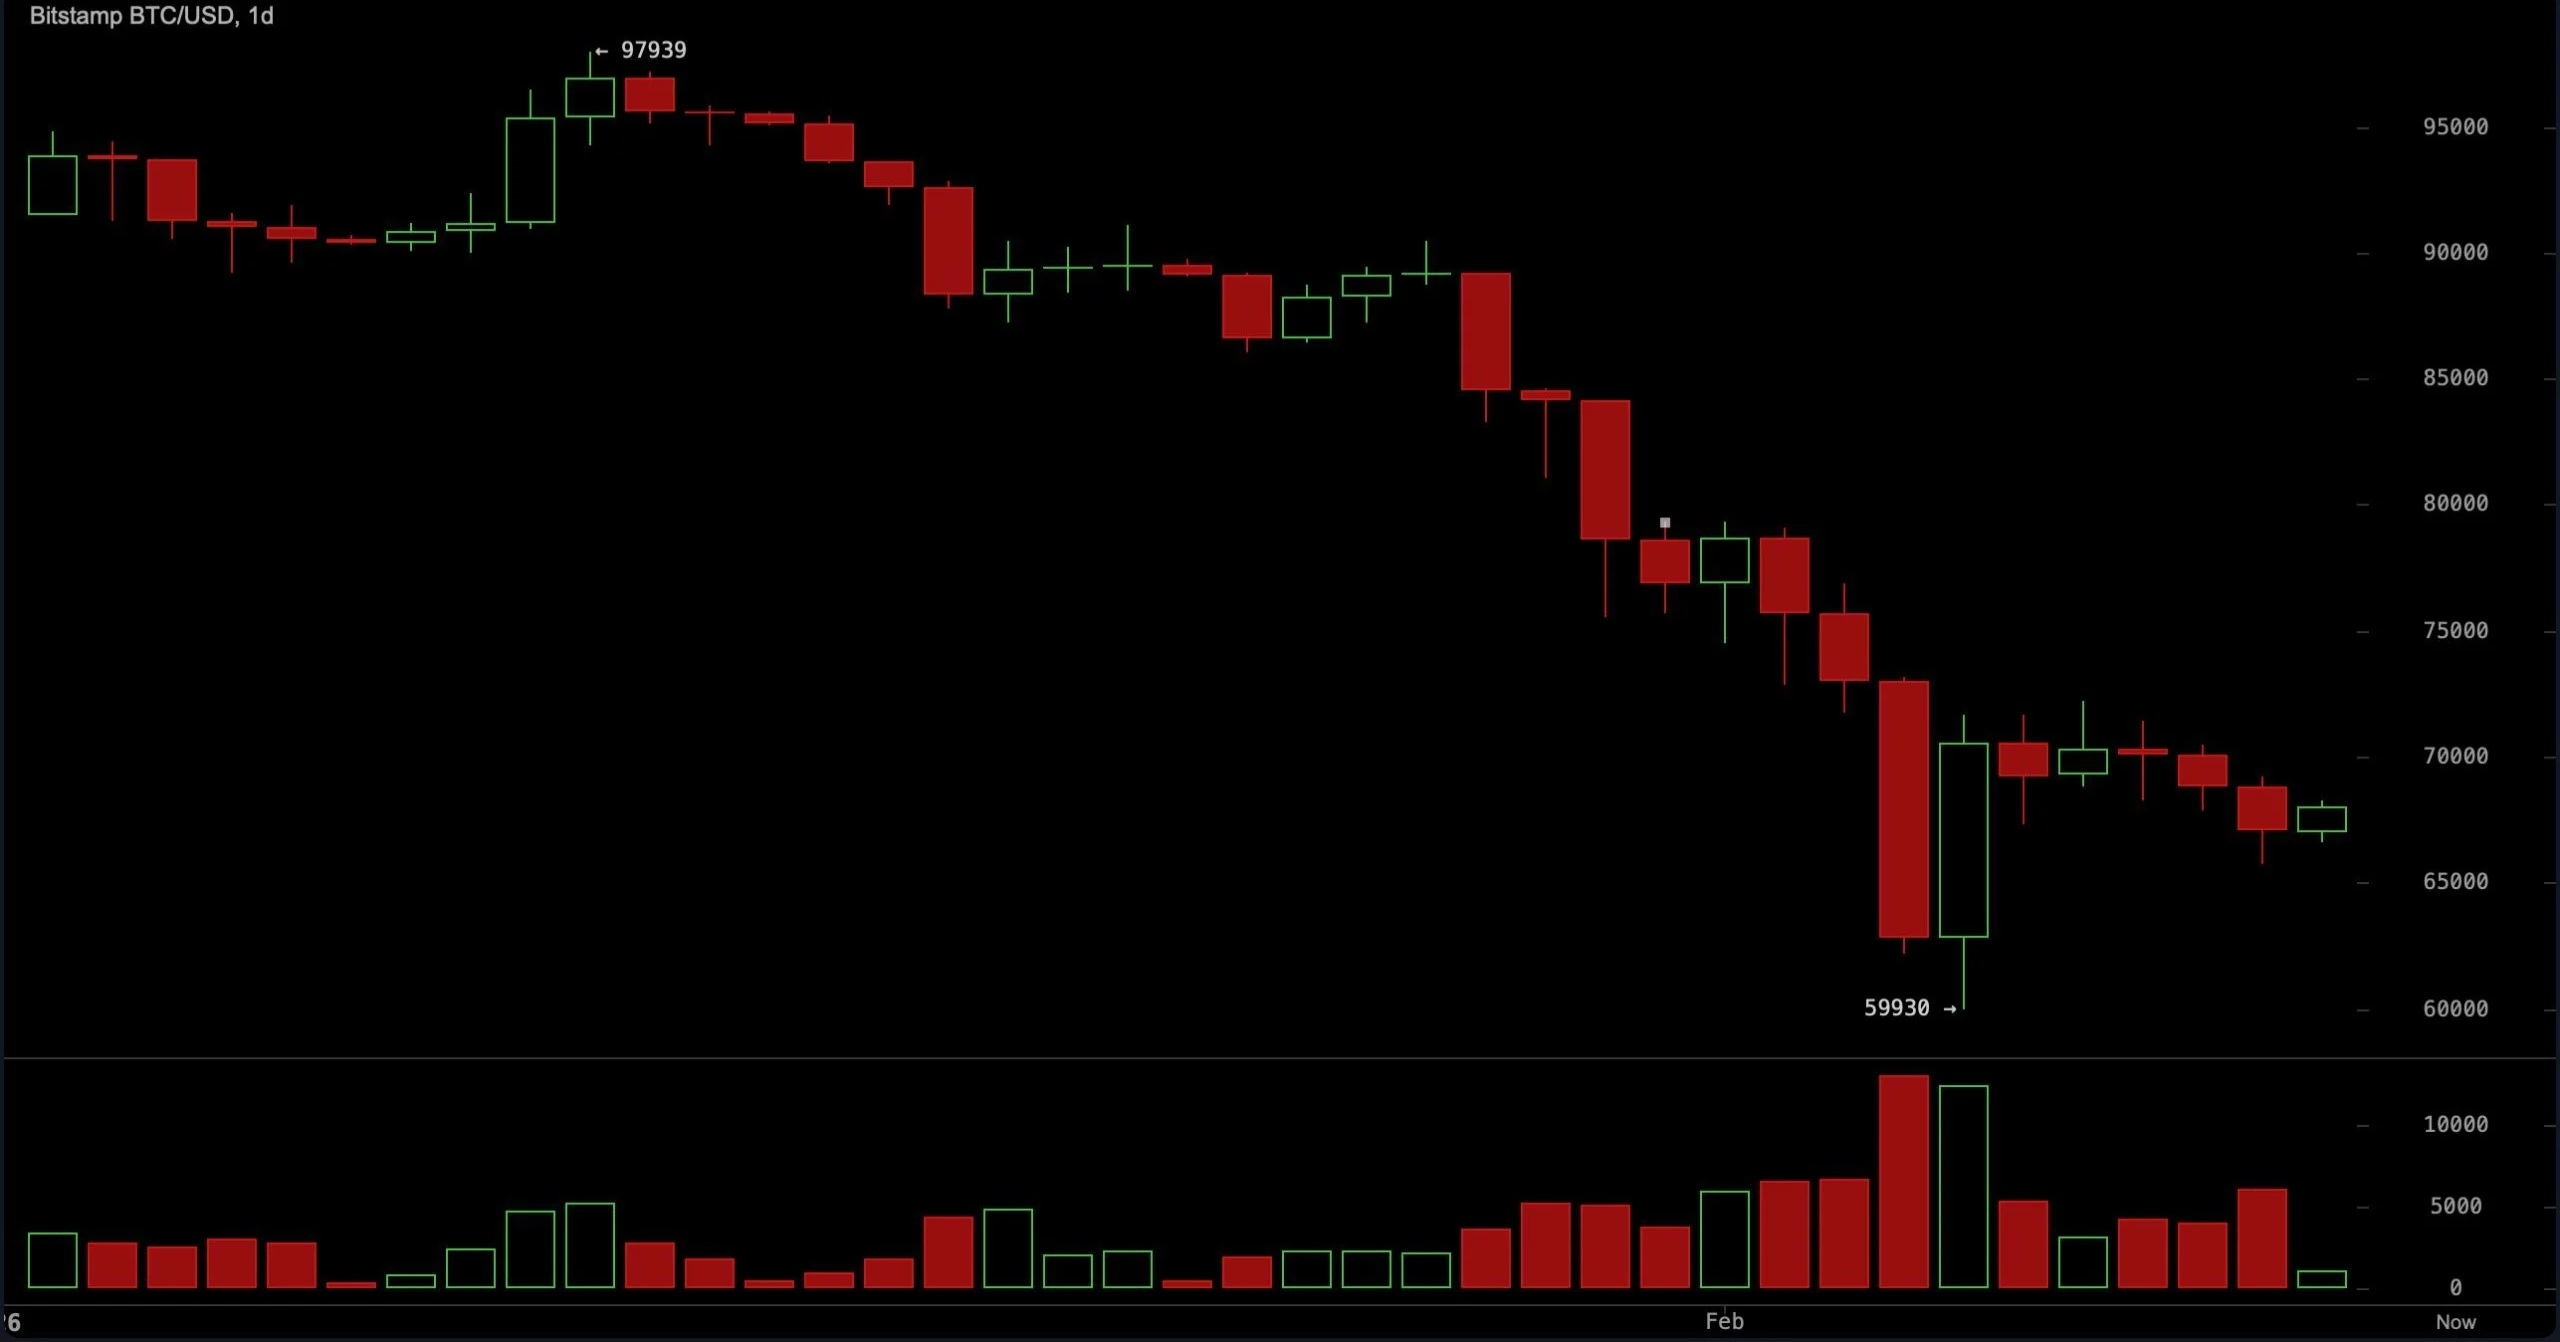
The daily chart continues to reflect a bearish macrostructure defined by a series of lower highs and lows following a sharp deviation near $97,900.
The capitulation wick towards approximately $59,930 marked exhaustion, followed by a bounce into the range of $68,000 to $70,000, where the price is currently compressing.
The main resistance remains between $70,000 and $72,000, while the broader supply zone extends from $75,000 to $80,000.
Support is set at $60,000, and a breakout below $59,000 opens the range from $52,000 to $54,000.
As long as Bitcoin does not regain the $72,000 level with strong volume, the daily trend remains bearish.
===========
On the four-hour timeframe, price action shows a corrective bounce forming within a broader descending trend. The recent low around $66,000 has yielded to a rise to $68,000 and $69,000, but volume is decreasing amid the rise, signaling weak confidence.
Resistance is concentrated between $69,500 and $71,000, while intraday support is at $66,000 with a key breakout level at $64,000.
Structurally, this looks more like a classic corrective movement than a decisive trend change—the kind of bounce that looks optimistic until it encounters resistance.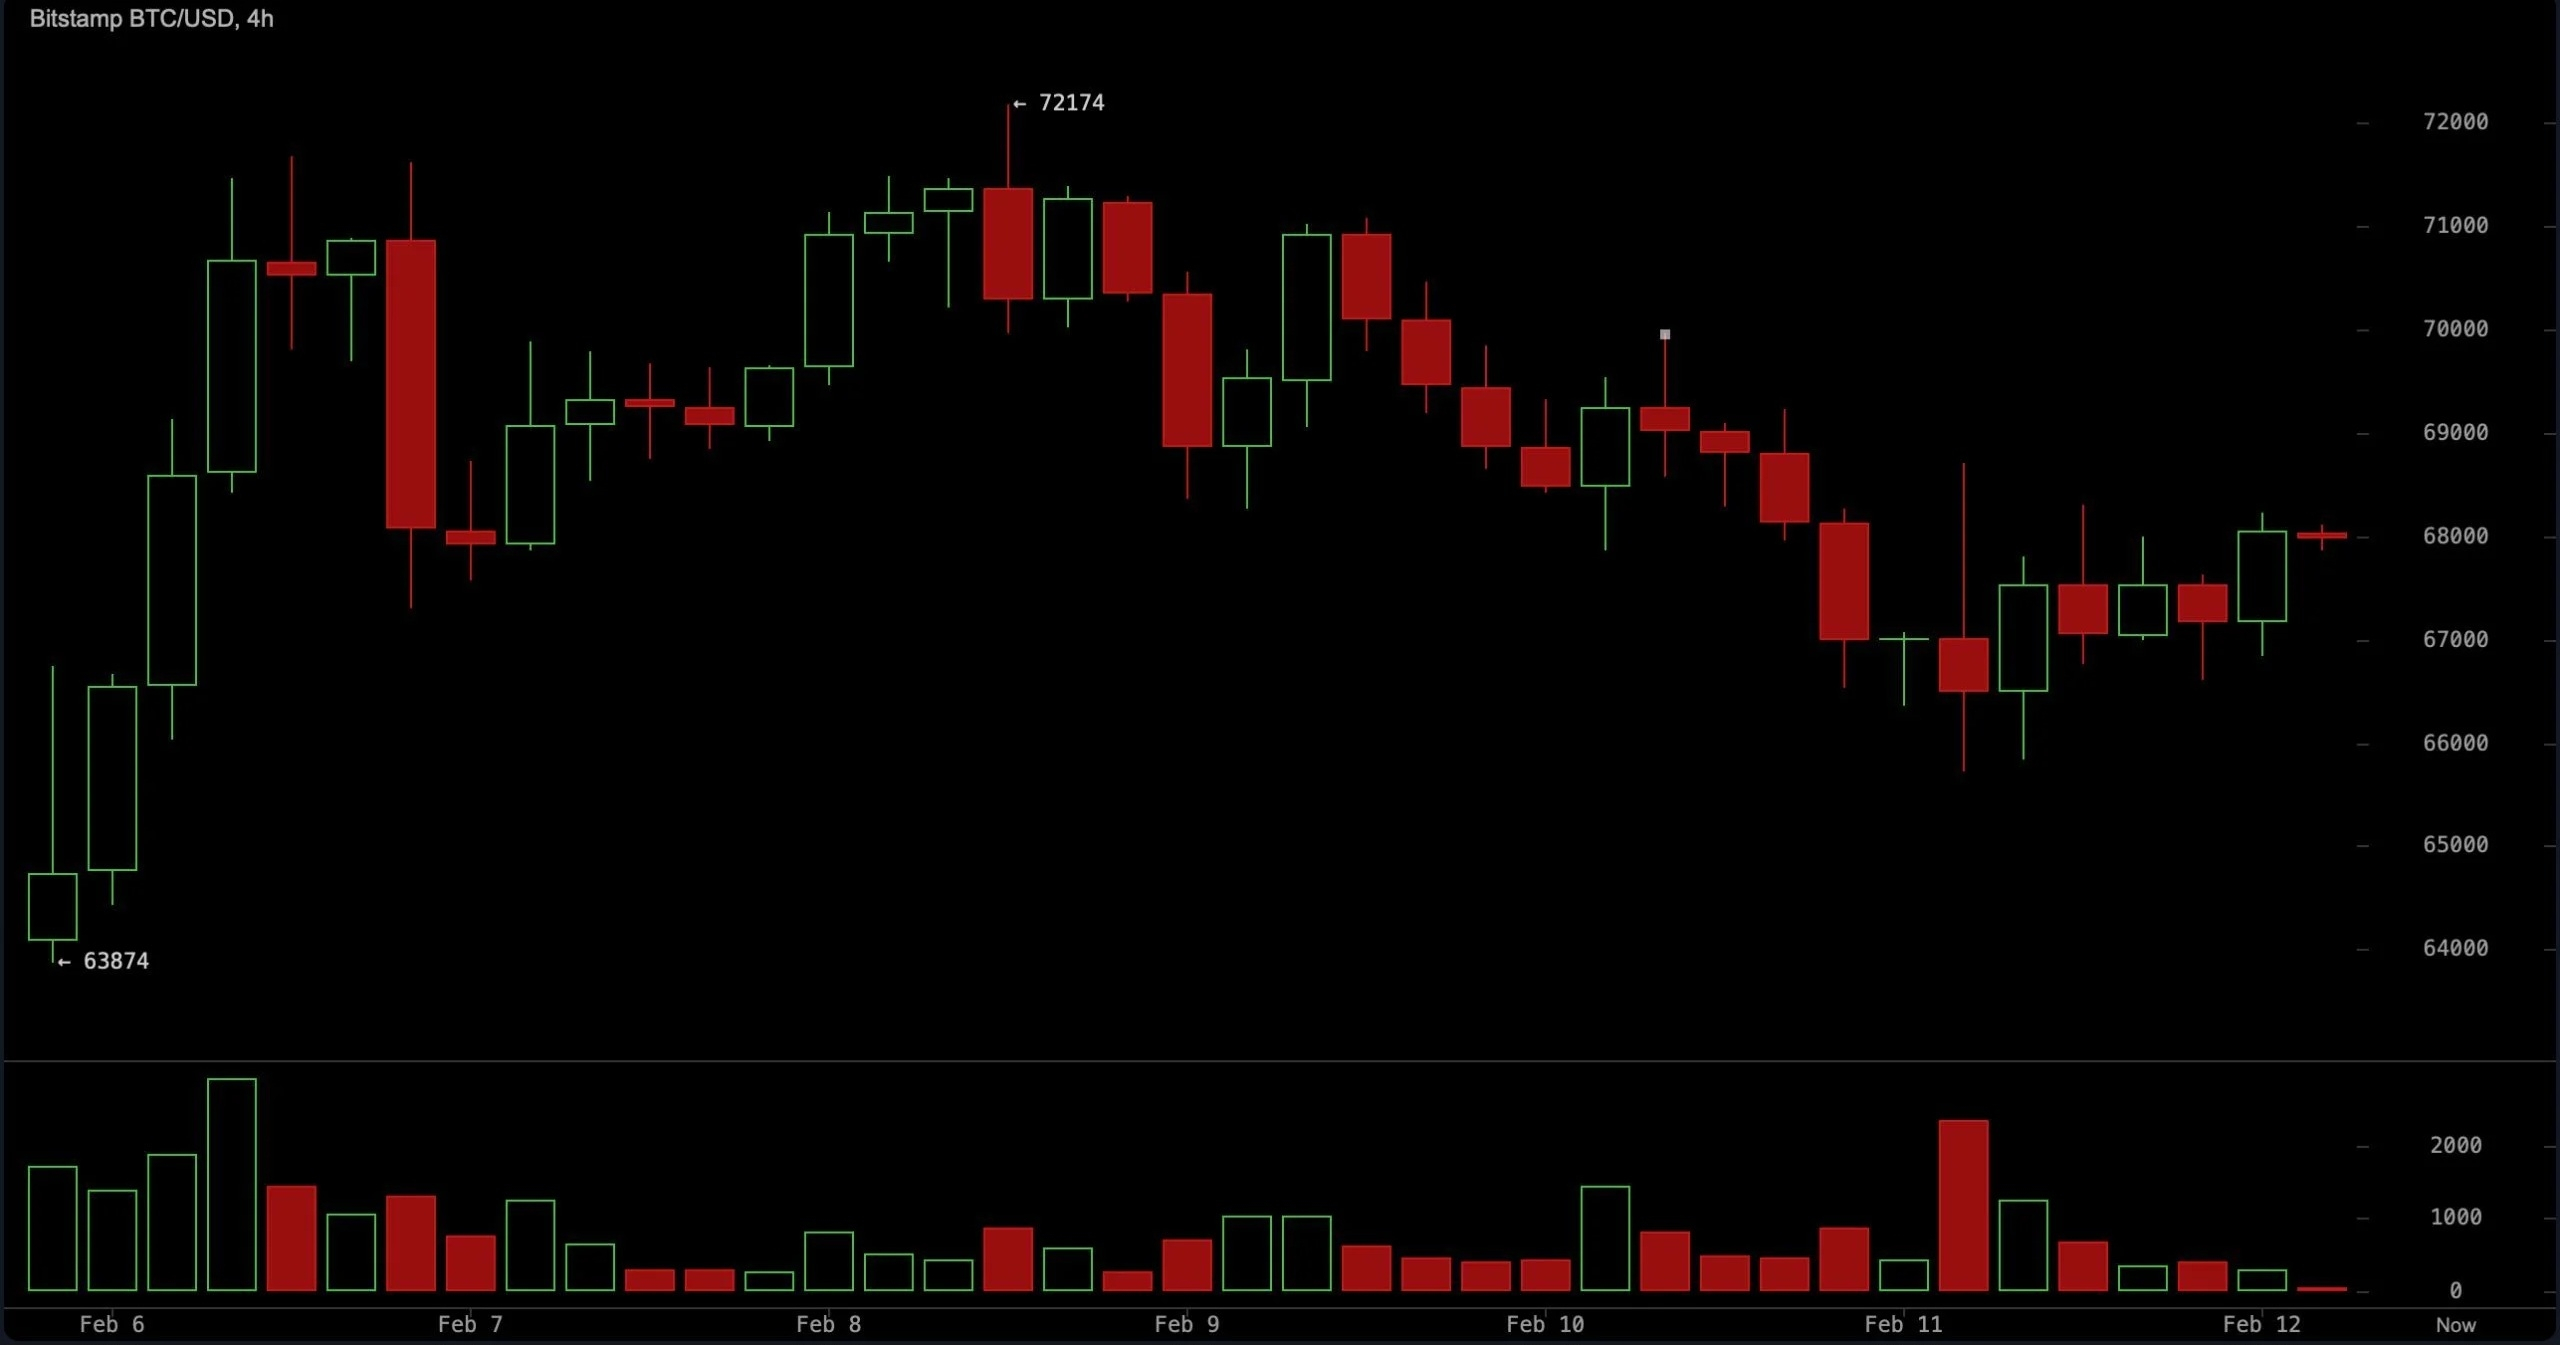
===========
The hourly chart presents a more constructive short-term picture, with a moderate 'higher high' and 'higher low' pattern signaling short-term bullish momentum.
Resistance is at $68,500–69,000, and the volume cannot be labeled explosive, meaning any breakout attempt requires confirmation. A sustained move above $69,000 opens the way to $70,000–71,000, while a loss of $67,000 invalidates this scenario.
Conversely, a failure in the range of $69,000 to $70,000 could bring the price back to $66,000 and possibly $64,000. Short-term optimism is present, but it is within a broader bearish trend.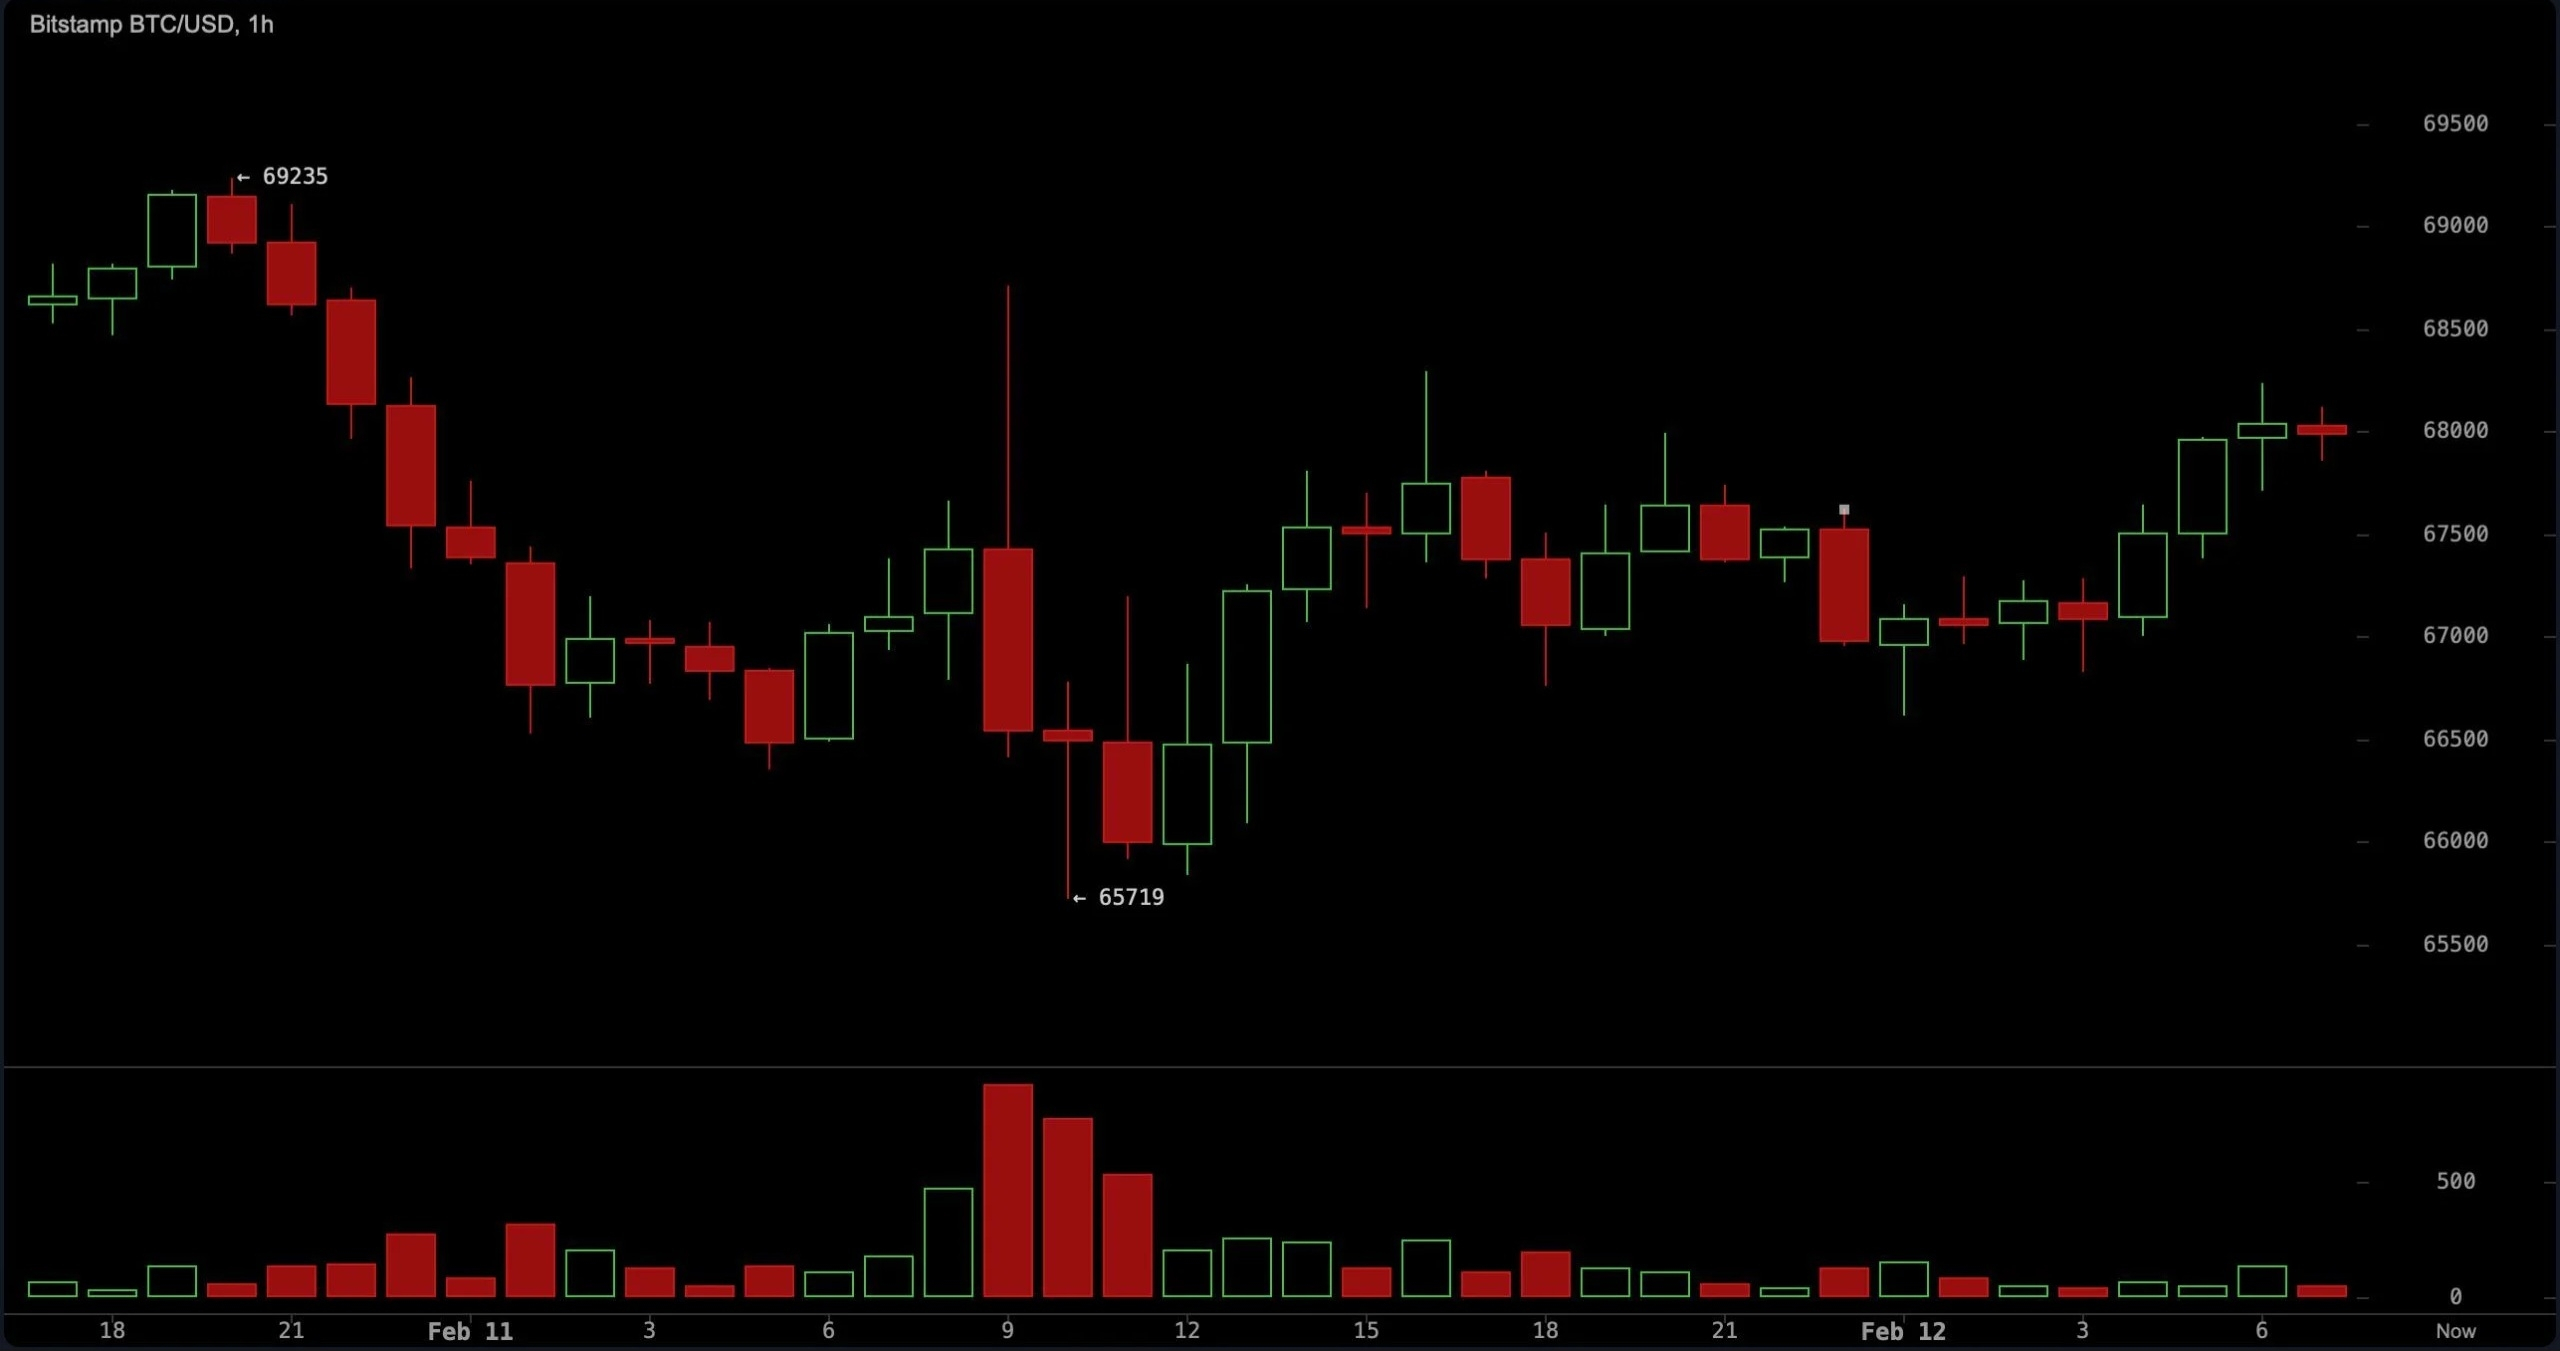
=========
Bullish verdict
If Bitcoin can decisively break above and hold above $69,000 with increasing volume, momentum on the hourly chart could extend to the resistance range of $70,000–72,000.
A confirmed recovery of the $72,000 level will begin to neutralize the daily bearish structure and challenge the prevailing pattern of lower highs.
In this scenario, the relief rally turns into something more significant in terms of structure, as the market shifts from a reactive bounce to a potential trend transition.
=========
Bearish verdict
The inability to hold strength near 69,000–70,000, especially if accompanied by an increase in the volume of decline, maintains a broader descending trend unchanged.
As the daily structure still shows lower highs, and moving averages are aligned downward, a rejection in this resistance range opens the way back to $66,000, then to $64,000, with $60,000 as the next major support.
As long as $72,000 is not confidently regained, rallies remain technically vulnerable within the prevailing bearish structure.