The cryptocurrency Solana has entered a correction phase after an unsuccessful attempt to consolidate its recent growth. The token reached a local peak of around $88 on February 8. After that, the quotes shifted to a steady decline.
====
Since then, the Solana price has fallen by almost 10%. Selling pressure has noticeably increased over the last 24 hours. The current decline does not yet signal a complete trend reversal. However, technical indicators and on-chain data raise concerns.
Hidden bearish divergence and asset inflows to exchanges have provoked a decline.
The first alarming signals appeared on the 12-hour chart a few trading sessions ago. From February 6 to 8, the price of Solana formed a lower peak around $88.
At the same time, the relative strength index (RSI) showed a higher peak. This indicator measures the momentum of buying and selling. When the price shows lower peaks, while the RSI shows higher ones, hidden bearish divergence occurs.
This pattern indicates a weakening of internal momentum. Externally, the quotes may look stable, but the strength of the movement is fading.
========
Important: Hidden bearish divergence often precedes the continuation of a downward trend, even when the market seems calm.
Shortly after this signal formed, the price began to decline. Selling pressure increased due to sharp changes in exchange flows. The net change indicator on exchanges tracks the movement of coins over 30 days.
A positive metric value means that investors are bringing tokens to exchanges for potential sale. On February 9, this indicator recorded a net outflow of −538,878 SOL. This indicated buying. However, by February 10, the situation changed dramatically. The metric showed a net inflow of about +245,691 SOL.
This reversal indicates an increase in seller activity. This factor explains the price drop of more than 4% over the past day. The combination of technical weakness and inflows of deposits to exchanges accelerated the correction.
========
Short-term investors are absorbing market supply.
The increase in exchange deposits is accompanied by interesting dynamics among buyers. Not all market participants are getting rid of assets. Nevertheless, the group that is currently buying the dip raises concerns among analysts.
The metrics of 'HODL Waves' show a change in ownership structure. The cohort of holders owning coins from one day to one week has increased its share. These wallets belong to speculators. They usually enter the market on pullbacks and quickly lock in profits or losses.
From February 8 to the present moment, the share of this group has increased from 5.39% to 6.81%. This is a sharp jump in speculative participation.
Historically, this group of investors rarely provides reliable support for the price. For example, on January 27, short-term holders controlled about 5.26% of the supply. At that time, the price of Solana was around $127. By January 30, their share had fallen to 4.31% after a sell-off. The asset price dropped by about 8%. A similar scenario is forming in the market now.
It is such reactive traders who are currently buying the dip.
At the same time, profit and loss data show: many still have little incentive to sell. The unrealized profit/loss (Net Unrealized Profit/Loss, NUPL) for short-term holders remains in the capitulation zone. NUPL compares the current price with their average purchase price to understand whether the holder is in profit or not.
On February 5, the short-term NUPL was around −0.95, indicating large losses. On the rebound, the indicator improved to −0.69, but after another decline, it dropped again to −0.76. This indicates that many of the latest buyers are still in the red and are not in a hurry to sell.
Therefore, short-term holders are not in a hurry to sell and temporarily provide support. However, with further losses, one should not expect their resilience.
=======
Solana's price levels indicate $75 as the key support zone.
When speculative demand prevails in the market, the price structure of SOL takes on special significance.
Solana has already lost the resistance level around $89. The main support is now concentrated around $75 — this is a psychologically important zone and a potential entry point for recent buyers. Approximately in this range, after the correction on February 6, investors expecting a rebound could have started buying.
If Solana holds above $75, short-term traders are likely to continue defending their positions, and the price will remain in sideways movement. However, this level is considered fragile — it is not supported by serious long-term accumulation.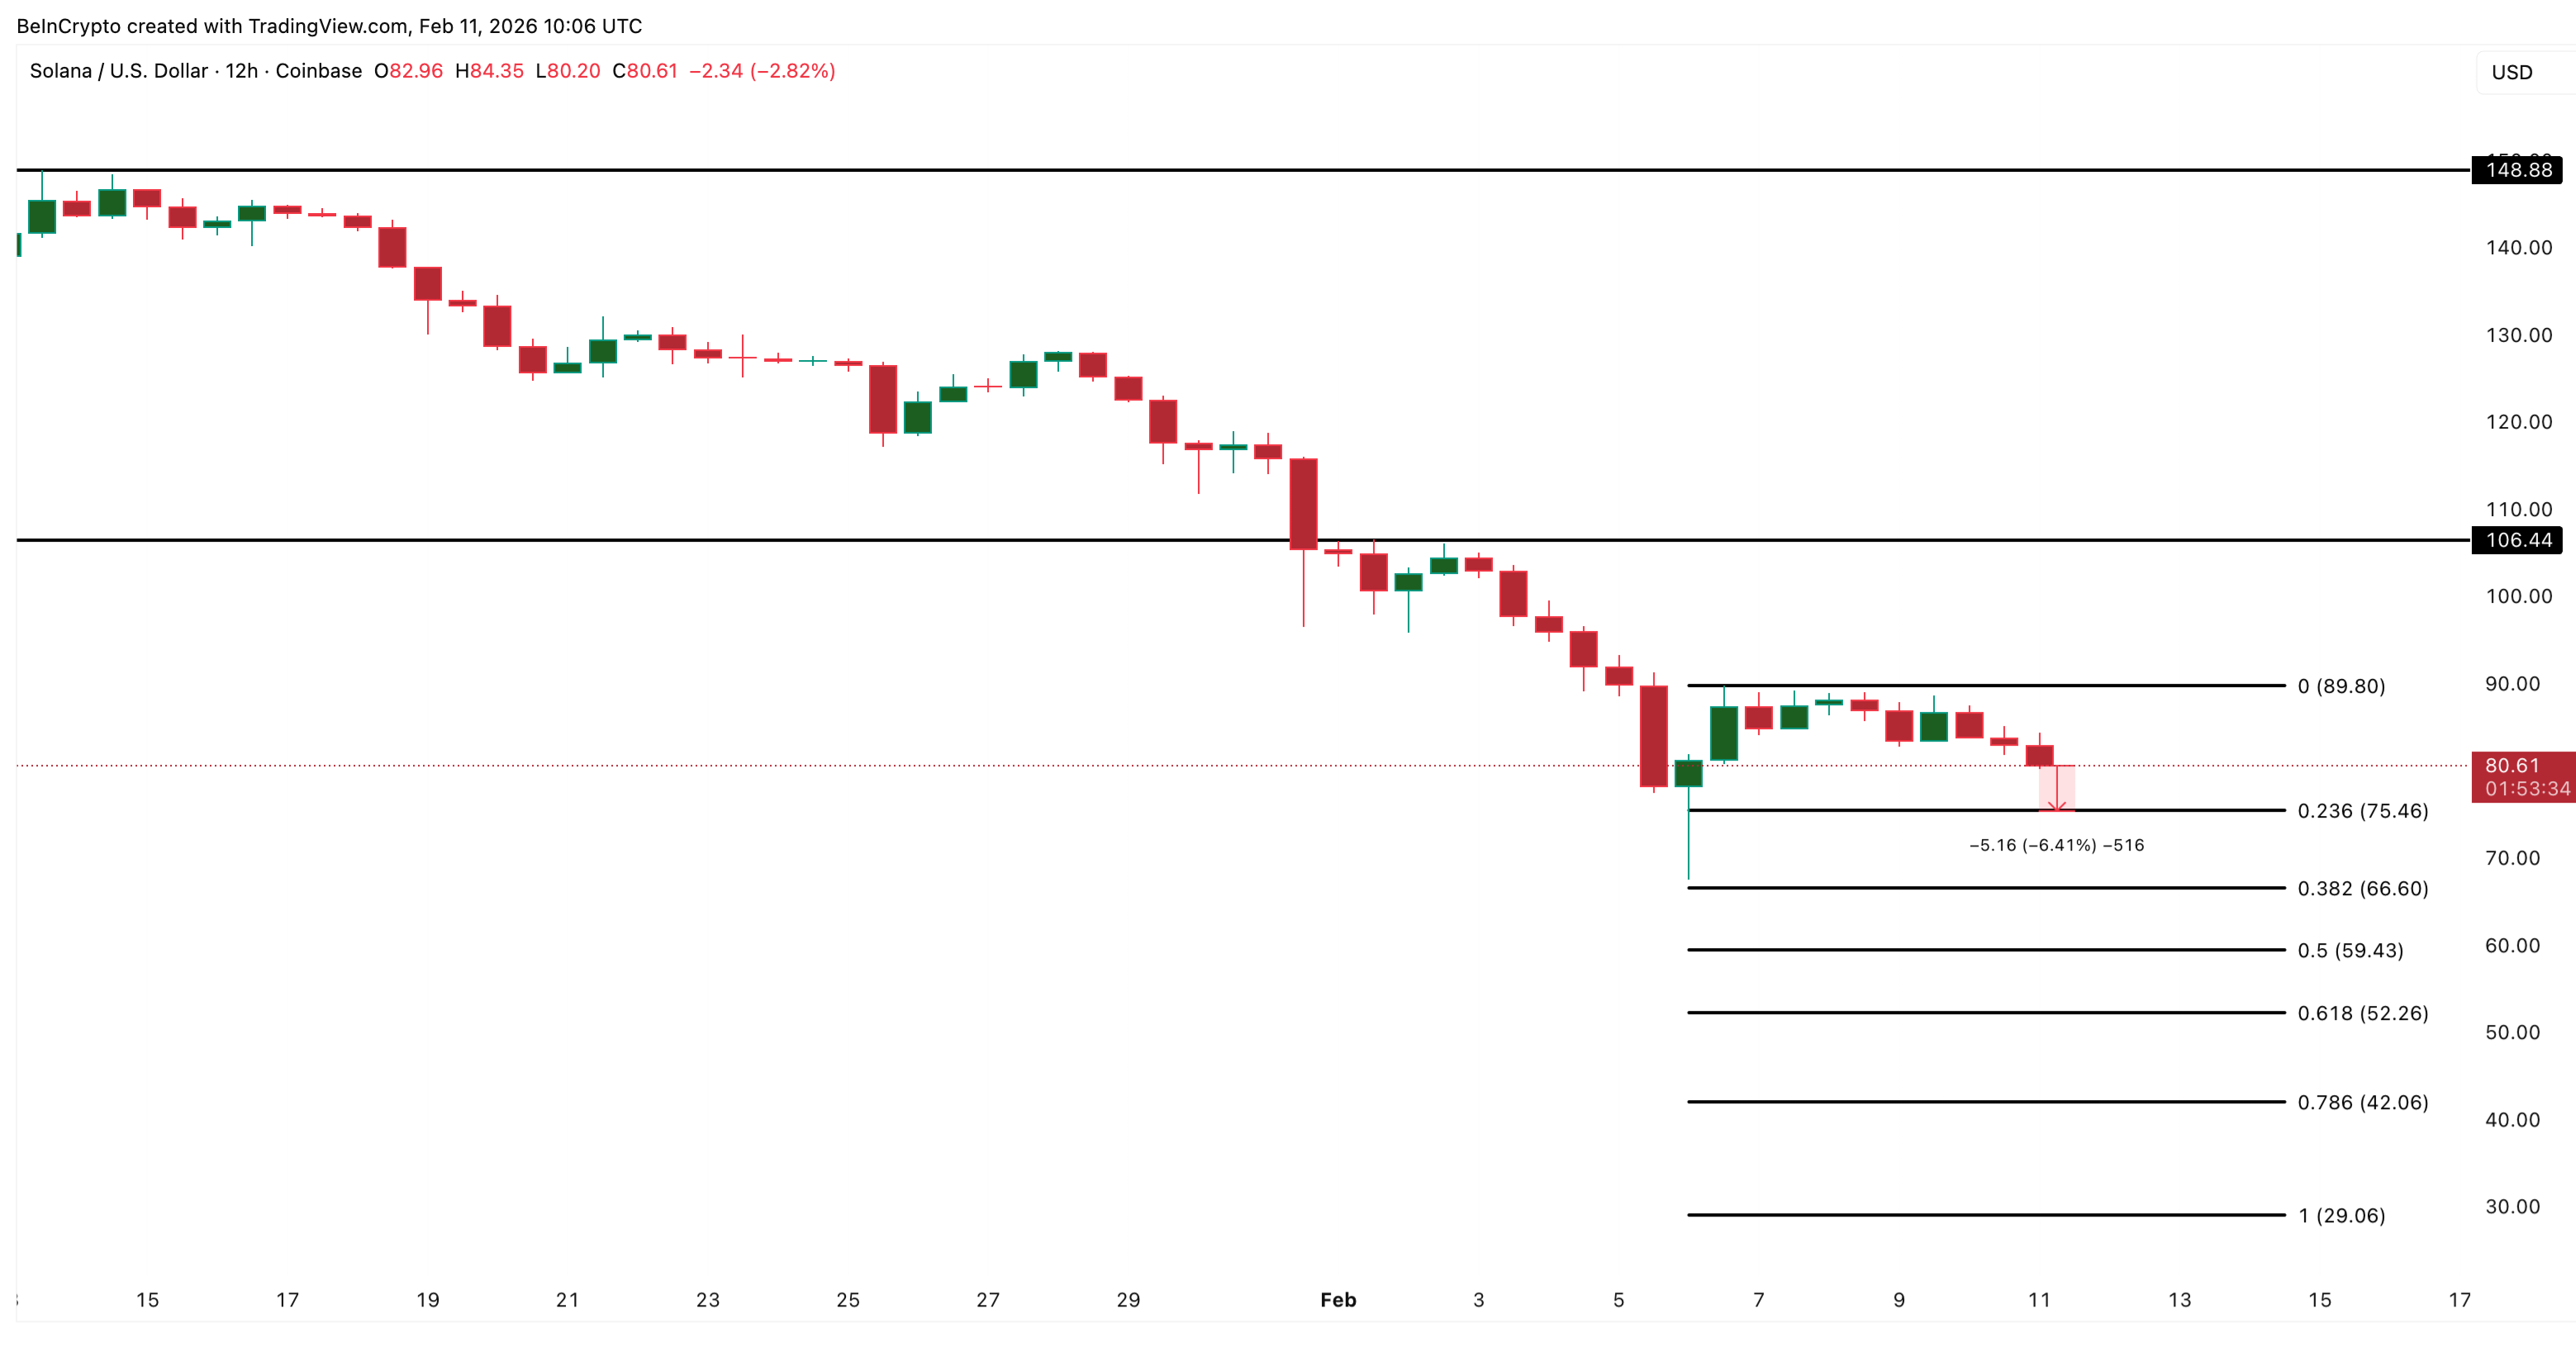
A clear close of the 12-hour candle below $75 could trigger a new wave of selling. Many recent buyers will find themselves deeply underwater, which will increase panic risks. If the $75 level does not hold, the next targets will be zones around $66 and $59.
The growth scenario now looks challenging. To regain momentum, Solana needs to recover above $89.
Only after breaking above $106 can we speak of a noticeable improvement in the overall situation on the chart.