The token quotes $XRP have recovered by more than 30% after bouncing off the local minimum in early February around $1.12. The momentum temporarily returned the price to the $1.50 zone. Externally, the movement looked constructive. Momentum indicators improved. A reversal pattern began to form on the chart. Market participants started discussing a potential trend change.
However, blockchain data reveals a different situation. Metrics do not show confident accumulation. On the contrary, statistics indicate that many holders used the price increase to exit losing positions. Sales at a loss continue to dominate. Several groups of investors are still reducing their risks. A logical question arises as to whether this bounce was a result of real demand or an opportunity for 'trapped' sellers to exit.
Technical picture and recovery potential
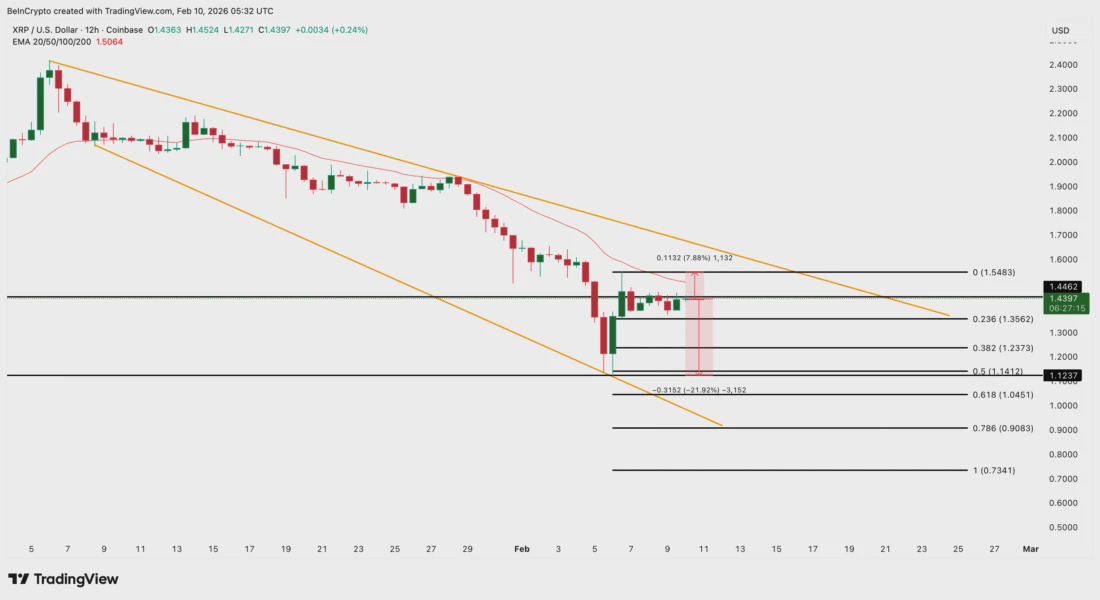
On the 12-hour chart, the asset is trading within a 'descending wedge' pattern. The potential for growth upon realization of this figure and breaking the upper boundary is about 56%.
To activate the scenario, the XRP price must consolidate above the short-term moving average. This refers to the 20-period exponential moving average (EEMA), which gives more weight to recent price values. This level acts as dynamic resistance in downtrends. At the beginning of January, a clean break of this EMA triggered a rally of almost 30%.
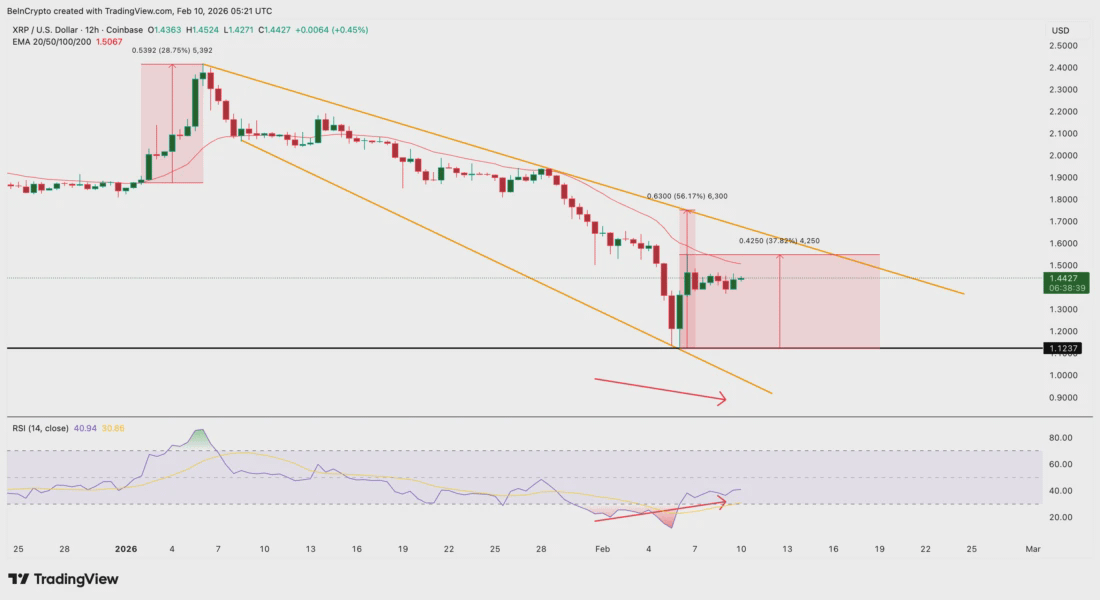
In addition, there is an improvement in momentum. From January 31 to February 9, the price established a new local minimum. At the same time, the relative strength index (RSI), which measures buyer and seller pressure, formed a higher low. This 'bullish' divergence usually indicates a weakening of seller positions.
This technical setup in itself indicates the probability of a bounce. However, graphic patterns only work if investors are willing to hold capital in the asset. To assess the sustainability of growth, it is necessary to analyze the on-chain behavior of market participants.
The indicators of loss-making trades of market participants
One of the clearest warning signals comes from the SOPR (Spent Output Profit Ratio) metric. This ratio indicates whether the coins being moved on the blockchain are sold at a profit or at a loss. A value above 1 indicates profit-taking. A value below 1 confirms that losses are being realized.
Since the end of January, SOPR for XRP has been held below one for more than ten consecutive days.
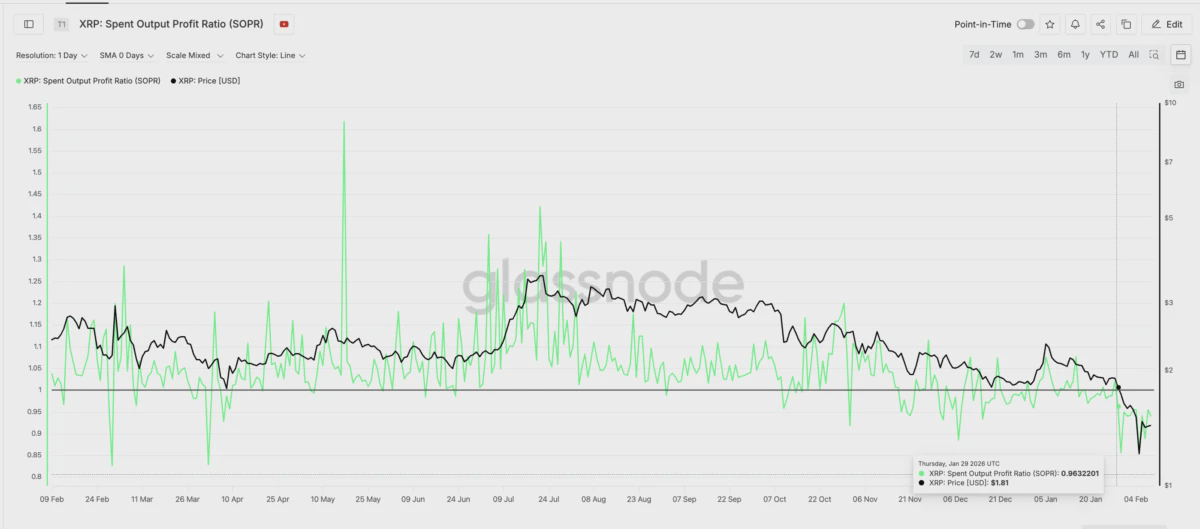
This is an atypical situation for a rising market. After a 30% recovery in quotes, short-term traders usually exit at a profit, which pushes SOPR upward. In this case, profitability has not recovered. Loss-selling continued even amid price growth. Therefore, a significant portion of holders continues to liquidate losing positions.
The market does not show a confident profit-taking. There is an exit from assets under stress pressure. To understand the structure of sellers, it is advisable to examine the behavior of different cohorts of holders.
Mass exit of short-term investors
The HODL Waves metric groups XRP wallets by the time of holding coins. This allows for identifying which groups of investors are buying or selling the asset. The most significant changes have been recorded in the cohort of daily holders (24-hour holders).
As of February 6, this group controlled about 1% of the circulating supply. Over a few days, their share fell to 0.09%. The decline was more than 90%.
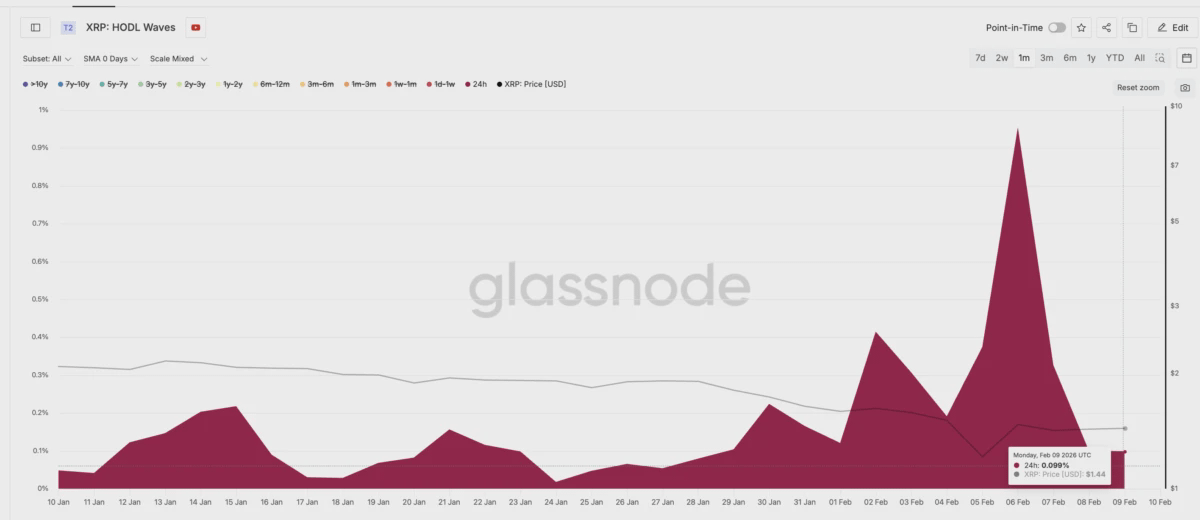
This concerns highly active traders who entered the market during periods of volatility and rushed to close positions at the first bounce. However, the selling was not limited to just this group.
The cohort of holders with a holding period of 1 to 3 months is also reducing its presence. These participants actively accumulated the token in January when the XRP price was around $2.07. Their share in the supply dropped from 14.48% in mid-January to 9.48% recently. The decline was about 35%.
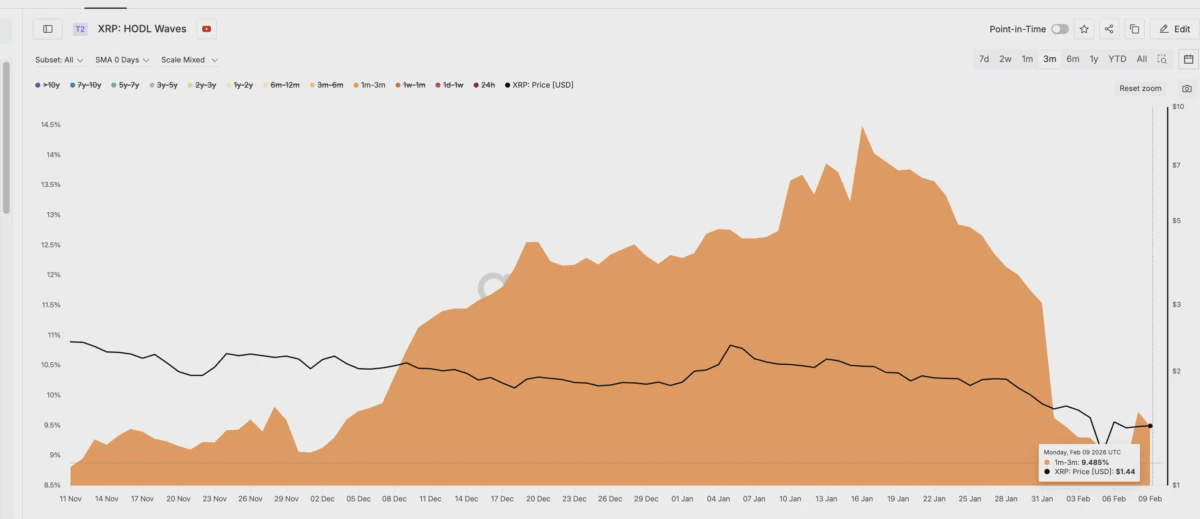
These investors remain at a loss. Instead of waiting for a full recovery, they use local growth to minimize losses. The combined actions of these two groups explain why the SOPR indicator remains suppressed for an extended period. Short-term speculators exit unsuccessful trades, while mid-term holders reduce risks. This behavior is characteristic of a distribution phase, not the beginning of a bull market.
Key resistance levels and forecast
Cost basis heat maps demonstrate areas of volume concentration. These levels often become resistance when the price returns to them.
For XRP, a powerful local cluster has formed in the range of $1.42–$1.44. More than 660 million coins have been accumulated in this zone. This creates a serious barrier for buyers.
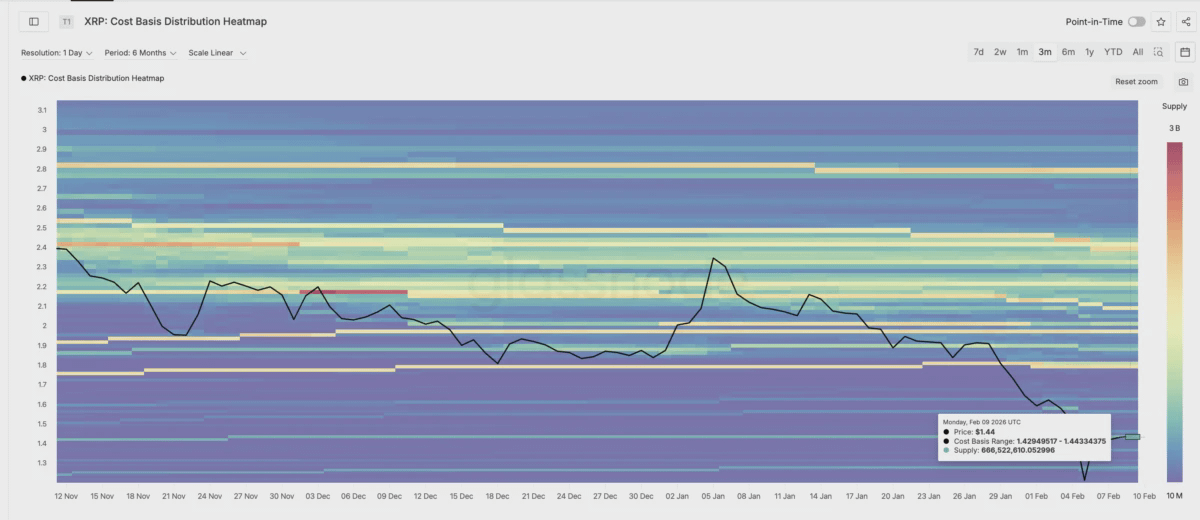
As prices approach this area, many holders exit at breakeven. After weeks in the 'red zone', they prefer to sell the asset. Above this cluster is the level of $1.54, which coincides with EMA resistance. These zones form a 'wall' that the asset has repeatedly failed to overcome. Each attempt to rise in this region is accompanied by increased selling.
Failure to consolidate above $1.44 increases the risks of a decline. A rejection of the breakout could send the price back to $1.23 and possibly to a recent minimum of $1.12. This would mean a drop of more than 20% from current values. Only a confident consolidation above $1.54 with the support of increasing profitability can change the current market structure.