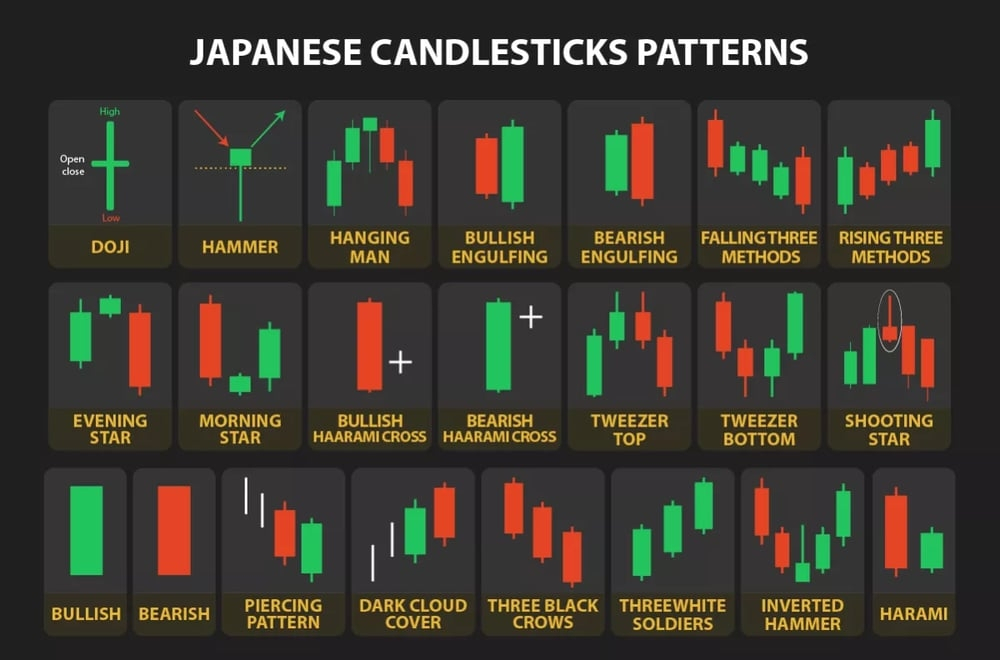
Japanese candles are a simple way to understand market movement, and each candle tells a story between buyers and sellers, from its shape you can estimate the potential direction.
1️⃣ Single Candle Patterns
Doji: Indecision and uncertainty, requires confirmation
Hammer: After a decline, buyers began to resist
Inverted Hammer: Beginning of buyer entry after a decline
Hanging Man: After an uptrend, buying strength decreases
Shooting Star: After an uptrend, potential weakness and beginning of a decline
2️⃣ Two Candlestick Patterns
Bullish Engulfing: Buyers in control
Bearish Engulfing: Sellers in control
Harami: Beginning of indecision in direction
Bullish Harami Cross: Selling pressure weakens
Bearish Harami Cross: Buyers hesitate
Tweezer Bottom: Potential reversal at the bottom
Tweezer Top: Potential reversal at the top
Piercing Pattern: Potential bullish reversal
Dark Cloud Cover: Potential bearish reversal
3️⃣ Three or more Candlestick Patterns
Morning Star: Potential upward movement
Evening Star: Potential decline
Three White Soldiers: Bullish momentum
Three Black Crows: Bearish momentum
Rising Three Methods: Continuation of upward movement
Falling Three Methods: Continuation of downward movement
💡 Alert:
Candles provide signals and probabilities only, not buy or sell orders
And it is stronger when aligned with the overall trend and support and resistance
#BinanceAcademy #tradingbasics #CryptoEducation💡🚀 #JapaneseCandlestick #USIranStandoff