This article is not just about the narrative of 'Bitcoin being expensive/cheap'.
This chart shows where institutional positioning psychology might break.
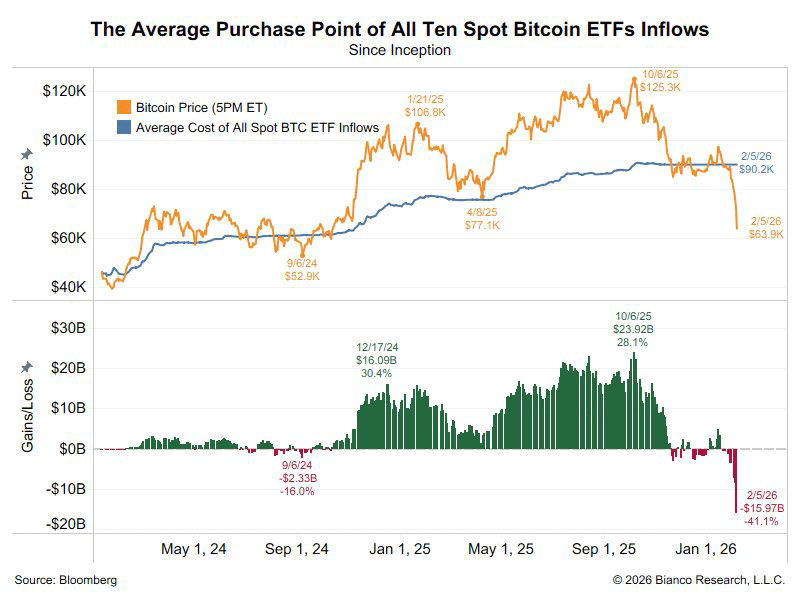
1️⃣ Detailed reality of the chart
•Average cost of spot ETFs: ≈ 90,000 $
•Bitcoin price: ≈ 64,000 $
•Total unrealized loss: –15.9 billion $ (%41)
This means that:
Almost all ETF investors are in loss, and this loss is not short-term trader loss, but balance sheet loss.
WHAT DOES THIS SITUATION REMIND US OF IN HISTORY?
🔁 Similarity 1: 2001–2002 NASDAQ
•Institutional funds bought technology stocks saying 'we are buying the future'
•Average cost remained above the price
•They did not sell at the first drop
•Passive exits began in the second and third waves
Important point:
Not because large funds are at a loss,
because the risk committee pressure started selling.
🔁 Similarity 2: Post-2008 Commodity ETFs
•Initial purchases came from above
•Average cost has been reduced
•Flow stopped when the price sharply dropped below the cost
•Then a horizontal-down squeeze lasting for months began
So:
ETFs do not create a bottom immediately, they spread over time.
THE MAIN MESSAGE OF THIS GRAPH
❗ Critical level: 90,000 $
This level is now:
•Not resistance
•Not a technical level
•Institutional psychological threshold
As long as the price stays below this level:
•New ETF entries are limited
•Old investors are in 'let me recover my loss' mode
•Every rise is used as a selling opportunity
This behavior does not resemble individual investors.
This is the reflex of portfolio optimization.
WHY WAS THERE NO PANIC SELLING?
There is an important detail in the graph:
–41% loss but still no mass ETF dissolution
This tells us:
•Positions are not leveraged
•Sales are not mandatory
•But patience is limited
This situation was the same in 2001 and 2008:
First phase is waiting, second phase is acceptance, third phase is optimization selling.
POSSIBLE SCENARIOS
🟢 Scenario 1: Gradual upward absorption over time (positive)
•Bitcoin stays in the 60–70K range for months
•ETF cost is reduced
•Loss drops to the 15–20% band
•New entries will start slowly
➡️ Condition for this scenario: No shock in macro
🟡 Scenario 2: Reaction rise → sale (most likely)
•A strong reaction comes between 70–80K
•ETF investors sell saying 'I reduced my loss'
•Price is suppressed again
➡️ 2001 Nasdaq and 2018 crypto followed this model
🔴 Scenario 3: Macro break → ETF dissolution
•Dollar liquidity tightens
•Risk committees reduce positions
•ETFs are forced to sell
➡️ This scenario will be fast but short
➡️ Real bottoms usually come after this phase
NET DEDUCTION
This graph says:
The problem in Bitcoin is not the price, but the cost structure.
And this cost structure does not rush the upside.
ETFs:
•What the bottom
•What the top
creates.
But it clearly shows where the price will struggle.
Currently that level: 90,000 $