Hello! 👋
In the last few hours, Bitcoin has been active 🎬, fluctuating between $104,850 and $107,200 USD 📈📉, currently around $107,130 USD! Record inflows in BTC ETFs 💰 in June (over $2.2 billion! 🤯) are boosting the overall market sentiment.
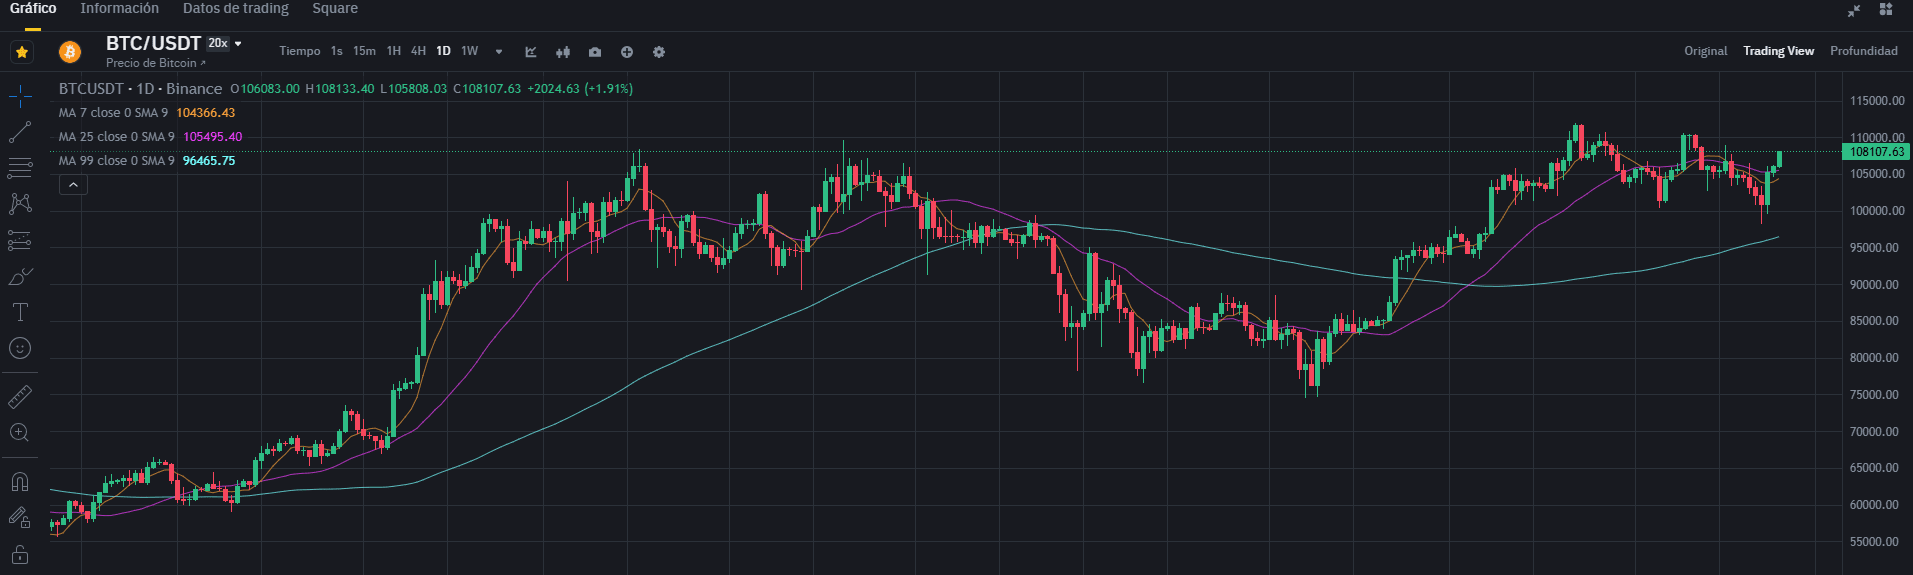
Detailed Analysis of Moving Averages and Stochastic 📈
To make the best decisions, let's take a look at the key indicators:
20 Moving Average (MA20): Bitcoin is struggling to stay above this line ⚔️, a clear sign of the intense battle between short-term buyers and sellers!
200 Moving Average (MA200): BTC remains solidly above this MA 💪, reaffirming a general long-term bullish trend. This is a crucial support level to watch! 👀
Stochastic Oscillator: This indicator helps us catch key moments:
POSSIBLE LONG (Buy) 🟢: If the stochastic is below 20 and its lines cross upwards ⬆️, it could mean that Bitcoin is oversold and ready for a bounce back! 🤸♂️
POSSIBLE SHORT (Sell) 🔴: If the stochastic is above 80 and its lines cross downwards ⬇️, it could indicate that Bitcoin is overbought and a correction is approaching! 📉
🎯 Trading Scenarios: Get ready!
For a Long 🚀: Look for Bitcoin to maintain the support of its MA200 and a bullish crossover of the stochastic from the oversold zone. A strong buying volume would be the perfect confirmation! ✅
For a Short 💥: Watch out if Bitcoin fails to hold the current levels, if the MA20 crosses downward 💔, and if the stochastic shows a bearish crossover from the overbought zone.
ATTENTION! 🚨 Cryptocurrency trading is high risk ⚠️. This is just a general analysis and not financial advice 🚫. Always do your own research 📚, use stop-loss 🛑, and manage your risk wisely! 🧠
Stay informed and trade cautiously! Have a great trading day. 🌟