There is a very simple trading method that almost guarantees 200% profit!
From this point on, seriously study trading coins; this method is actually very simple. There are only 4 steps: selecting currencies, buying, position management, and selling. Every detail will be explained clearly to you!
The first step is to open the daily chart and only look at the daily level. For the MACD golden cross, it's best to choose one that is above the O axis; this effect is the best!
The second step is to switch to the daily level, here we only need to look at one moving average, called the daily moving average, buy when it's above the line, and sell when it's below.
The third step is to buy in when the price breaks above the daily moving average, and the volume is also above the daily moving average; then buy with the entire position. The fourth step is to sell, which is divided into three details: first, when the wave's increase exceeds 40%, sell 1/3 of the overall position; second, when the overall wave's increase exceeds 80%, sell another 1/3, and sell all when it falls below the daily moving average.
The fourth step is also the most important one. Since we are using the daily moving average as our buying basis, if an unexpected situation occurs the next day and it directly falls below, then we must sell everything and not hold any hopes! Although with our method of selecting coins, the probability of a drop is very low! But we still need to have a risk awareness! After selling, wait for it to stand back above the daily moving average.
You can just take it back from the new connection! Many people say: The longest road I have walked is the routine of the crypto world. Many people enter the crypto space with the attitude of making money, not realizing that in reality, only 10% of people make money, and the remaining 90% can only become pitiful non-players who get cut. So, how can one become part of that 10% that makes money? Let's find out.
The most basic method of market analysis: finding resistance and support levels. Candlesticks can establish people's beliefs and can also destroy them; this is a different language compared to everyday speech and computer language.
Today, Tong Tong will talk to you about the most basic method of market analysis—finding support levels. Market analysis experts do not need to read this article, as its audience is more for friends who do not trade coins often, especially those who have recently entered the market due to the sudden surge and have invested heavily.
There are differing opinions on whether market analysis is useful; in fact, its usefulness depends on how it is used and whether the research is deep enough. This is a discipline; you cannot assume you are an expert just because of your glorious results, nor should you be discouraged by a temporary mistake. Over a long period, the world has no luck, only probability and effort. First, we open Aicoin* or tradingview and other market analysis software, and open the weekly chart.
Why use the weekly chart? The longer the cycle, the more accurately resistance and support levels can be identified. Because the aggregation of trading volume is more concentrated, if you are looking for resistance and support levels, the 15-minute and 4-hour charts do not have significant reference meaning.
Explanation of resistance and support levels: Resistance is when there is selling pressure when reaching this position, so there is some pressure when pushing upwards. Generally, we reduce our positions in the face of strong resistance. When it effectively exceeds the resistance level, we add positions after a volume breakout. This mindset is different from that of friends who have just started trading coins; you might say, 'Doesn't this raise my average cost?' Yes, the average cost is higher, but the probability of profit is greater.
Once the resistance level is broken and held, the past resistance level becomes the current support level. The two positions of resistance and support are just different names, constantly switching with the passage of time and changes in the market.
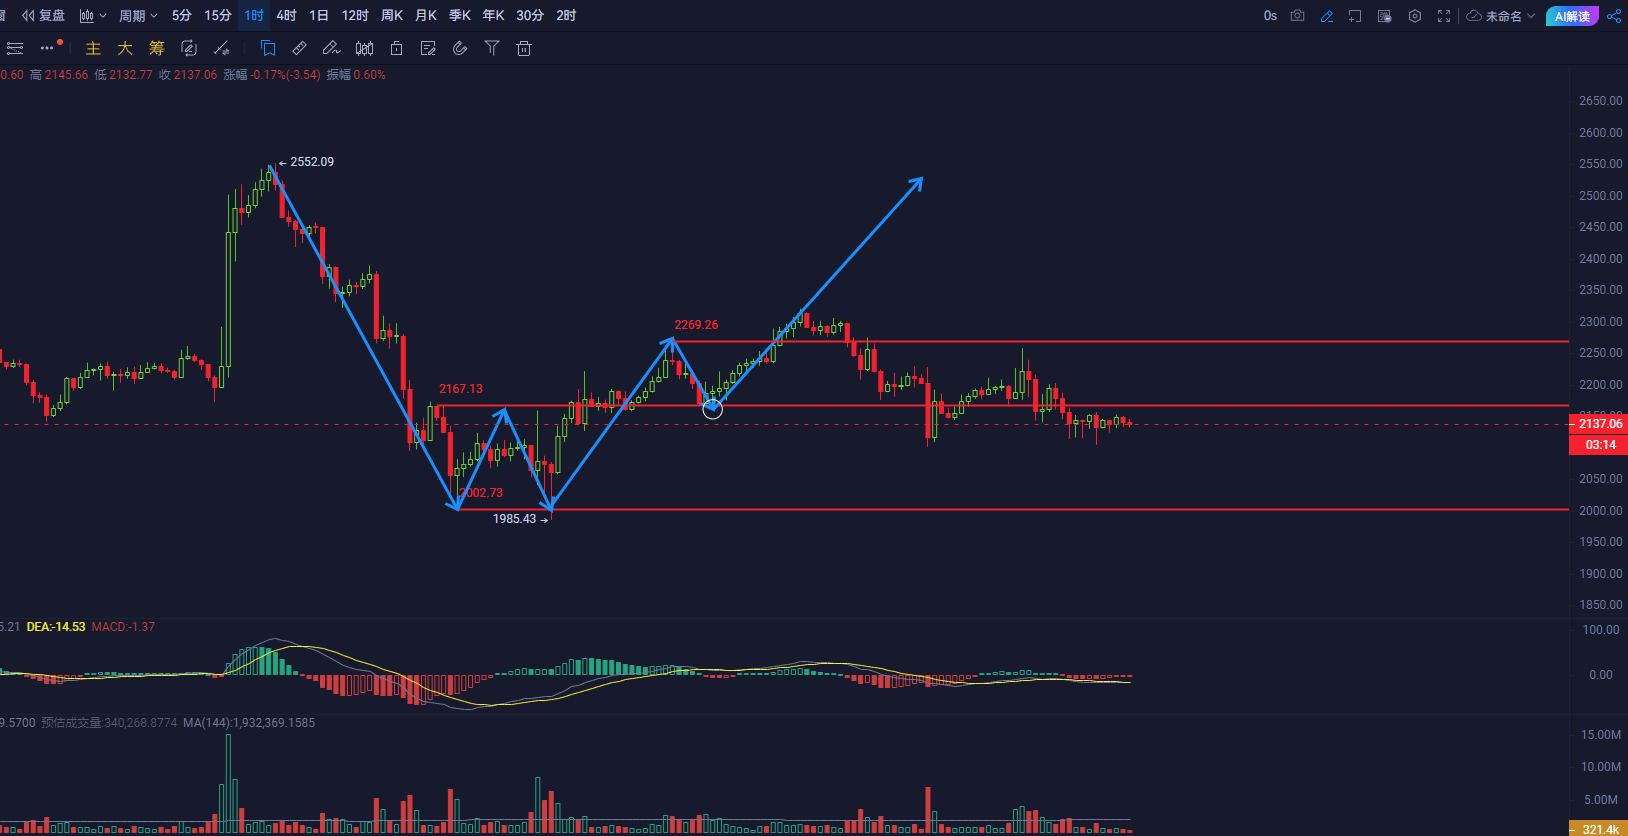
Adding or reducing positions is not based on feelings, but rather when you see support and resistance levels, you perform the operations. When looking at the overall trend from a weekly level, there is not much operation because it's not yet the time to act. The so-called 'breaking position to add positions' and 'breaking position to reduce positions' basically constitutes the analysis of resistance and support levels; the 'position' that is broken is this one. (White circle)
Of course, this is the most basic analysis method, which is basically enough for retail investors. However, if we can also analyze the strength of support levels with volume (which is the bars at the bottom of the chart), it can be very helpful. As for indicators like MA, EMA, Fibonacci, Bollinger Bands, RSI, etc., they are indeed useful, but the key is to use them well. When you finish studying all the indicators and find yourself inevitably losing money, you will realize that 'the simplest way is the best.' The useful ones are just a few indicators, while resistance and support levels are the most important. In the future, there will be high-frequency trading robots analyzing the market (which is almost nonexistent in the crypto space right now). This is something that humans cannot achieve, belonging to the realm of robots. The robots I'm referring to are not the existing quantitative trading robots on the market; those most of the time lack real quantification and are merely automated trading strategy robots. So why are they called 'quantitative robots'? Because on one hand, a grand name sells products better; on the other hand, the term 'quantitative' is very broad, so it's not wrong to call it that.
What we talked about today is just the most basic knowledge, but it is somewhat useful. When we face the market, it's like a man facing a woman; not understanding a woman's thoughts is quite normal, and it can get awkward if we don't understand obvious hints. The candlestick chart is the market's hint to us, knowing a little is not a bad thing.
$DOGE $PEPE $BNX #白宫首届加密货币峰会 #币安优化上币机制 #非农就业数据来袭