
Here's the distinction that separates those who
build wealth from those who blow up accounts.
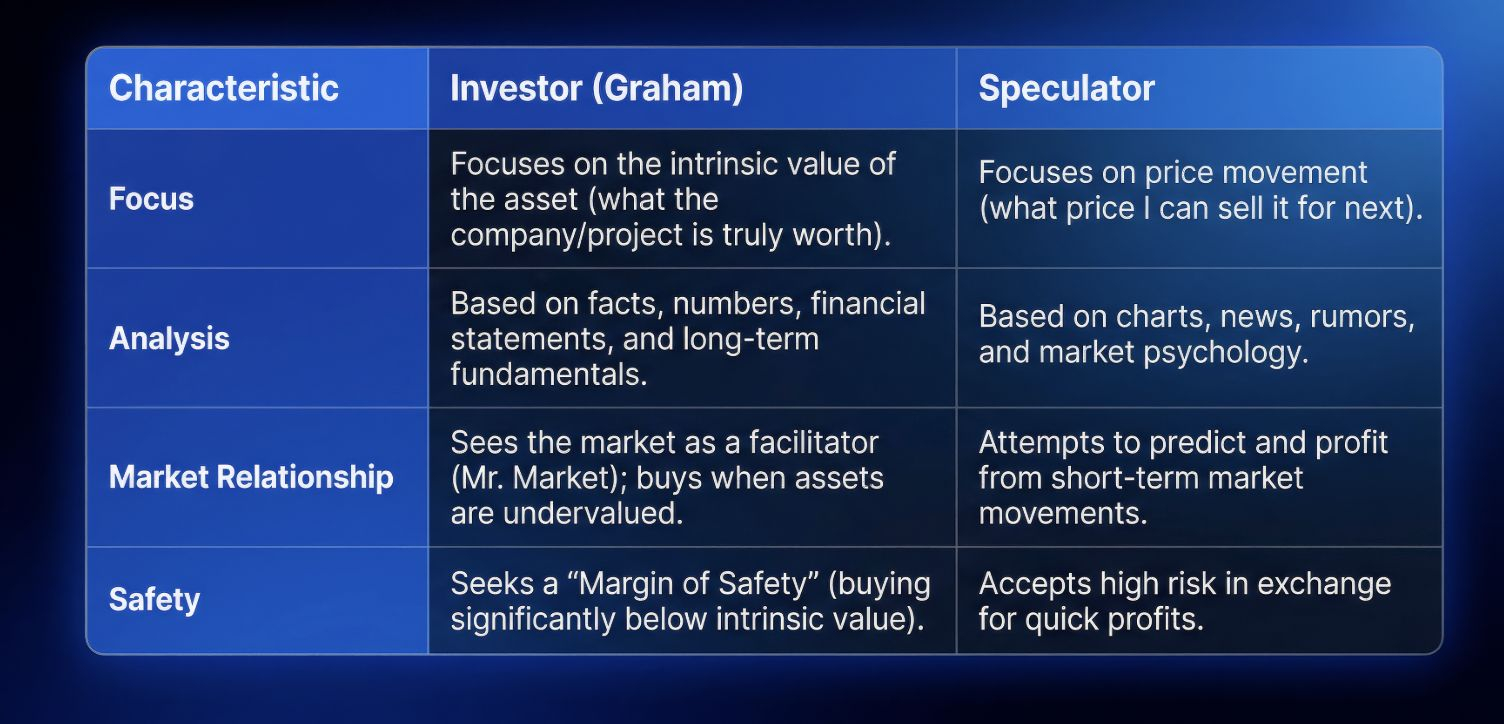
Graham's definition is ruthless:
An investment operation is one which, upon thorough
analysis, promises safety of principal and an adequate
return.
Everything else is speculation.
The difference isn't what you buy.
It's the analysis, and the intention, behind the buy.
→ The Investor sees a token as a stake in a real project.
Studies cash flow, fundamentals, intrinsic value.
Buys when price is below that value.
Profits from the project's success over time.
→ The Speculator focuses on price movement and market
psychology.
Buys expecting to sell to someone else at a higher price.
(The "greater fool" theory.)
Profits from short-term market fluctuations.
Both roles are necessary for markets to function.
The investor provides stability, buying when panic selling
pushes prices below fair value, anchoring assets and ensuring
capital flows to productive projects.
The speculator provides liquidity, bringing volume, absorbing
risk on early-stage assets, and ensuring you can enter or exit
a position at any moment.
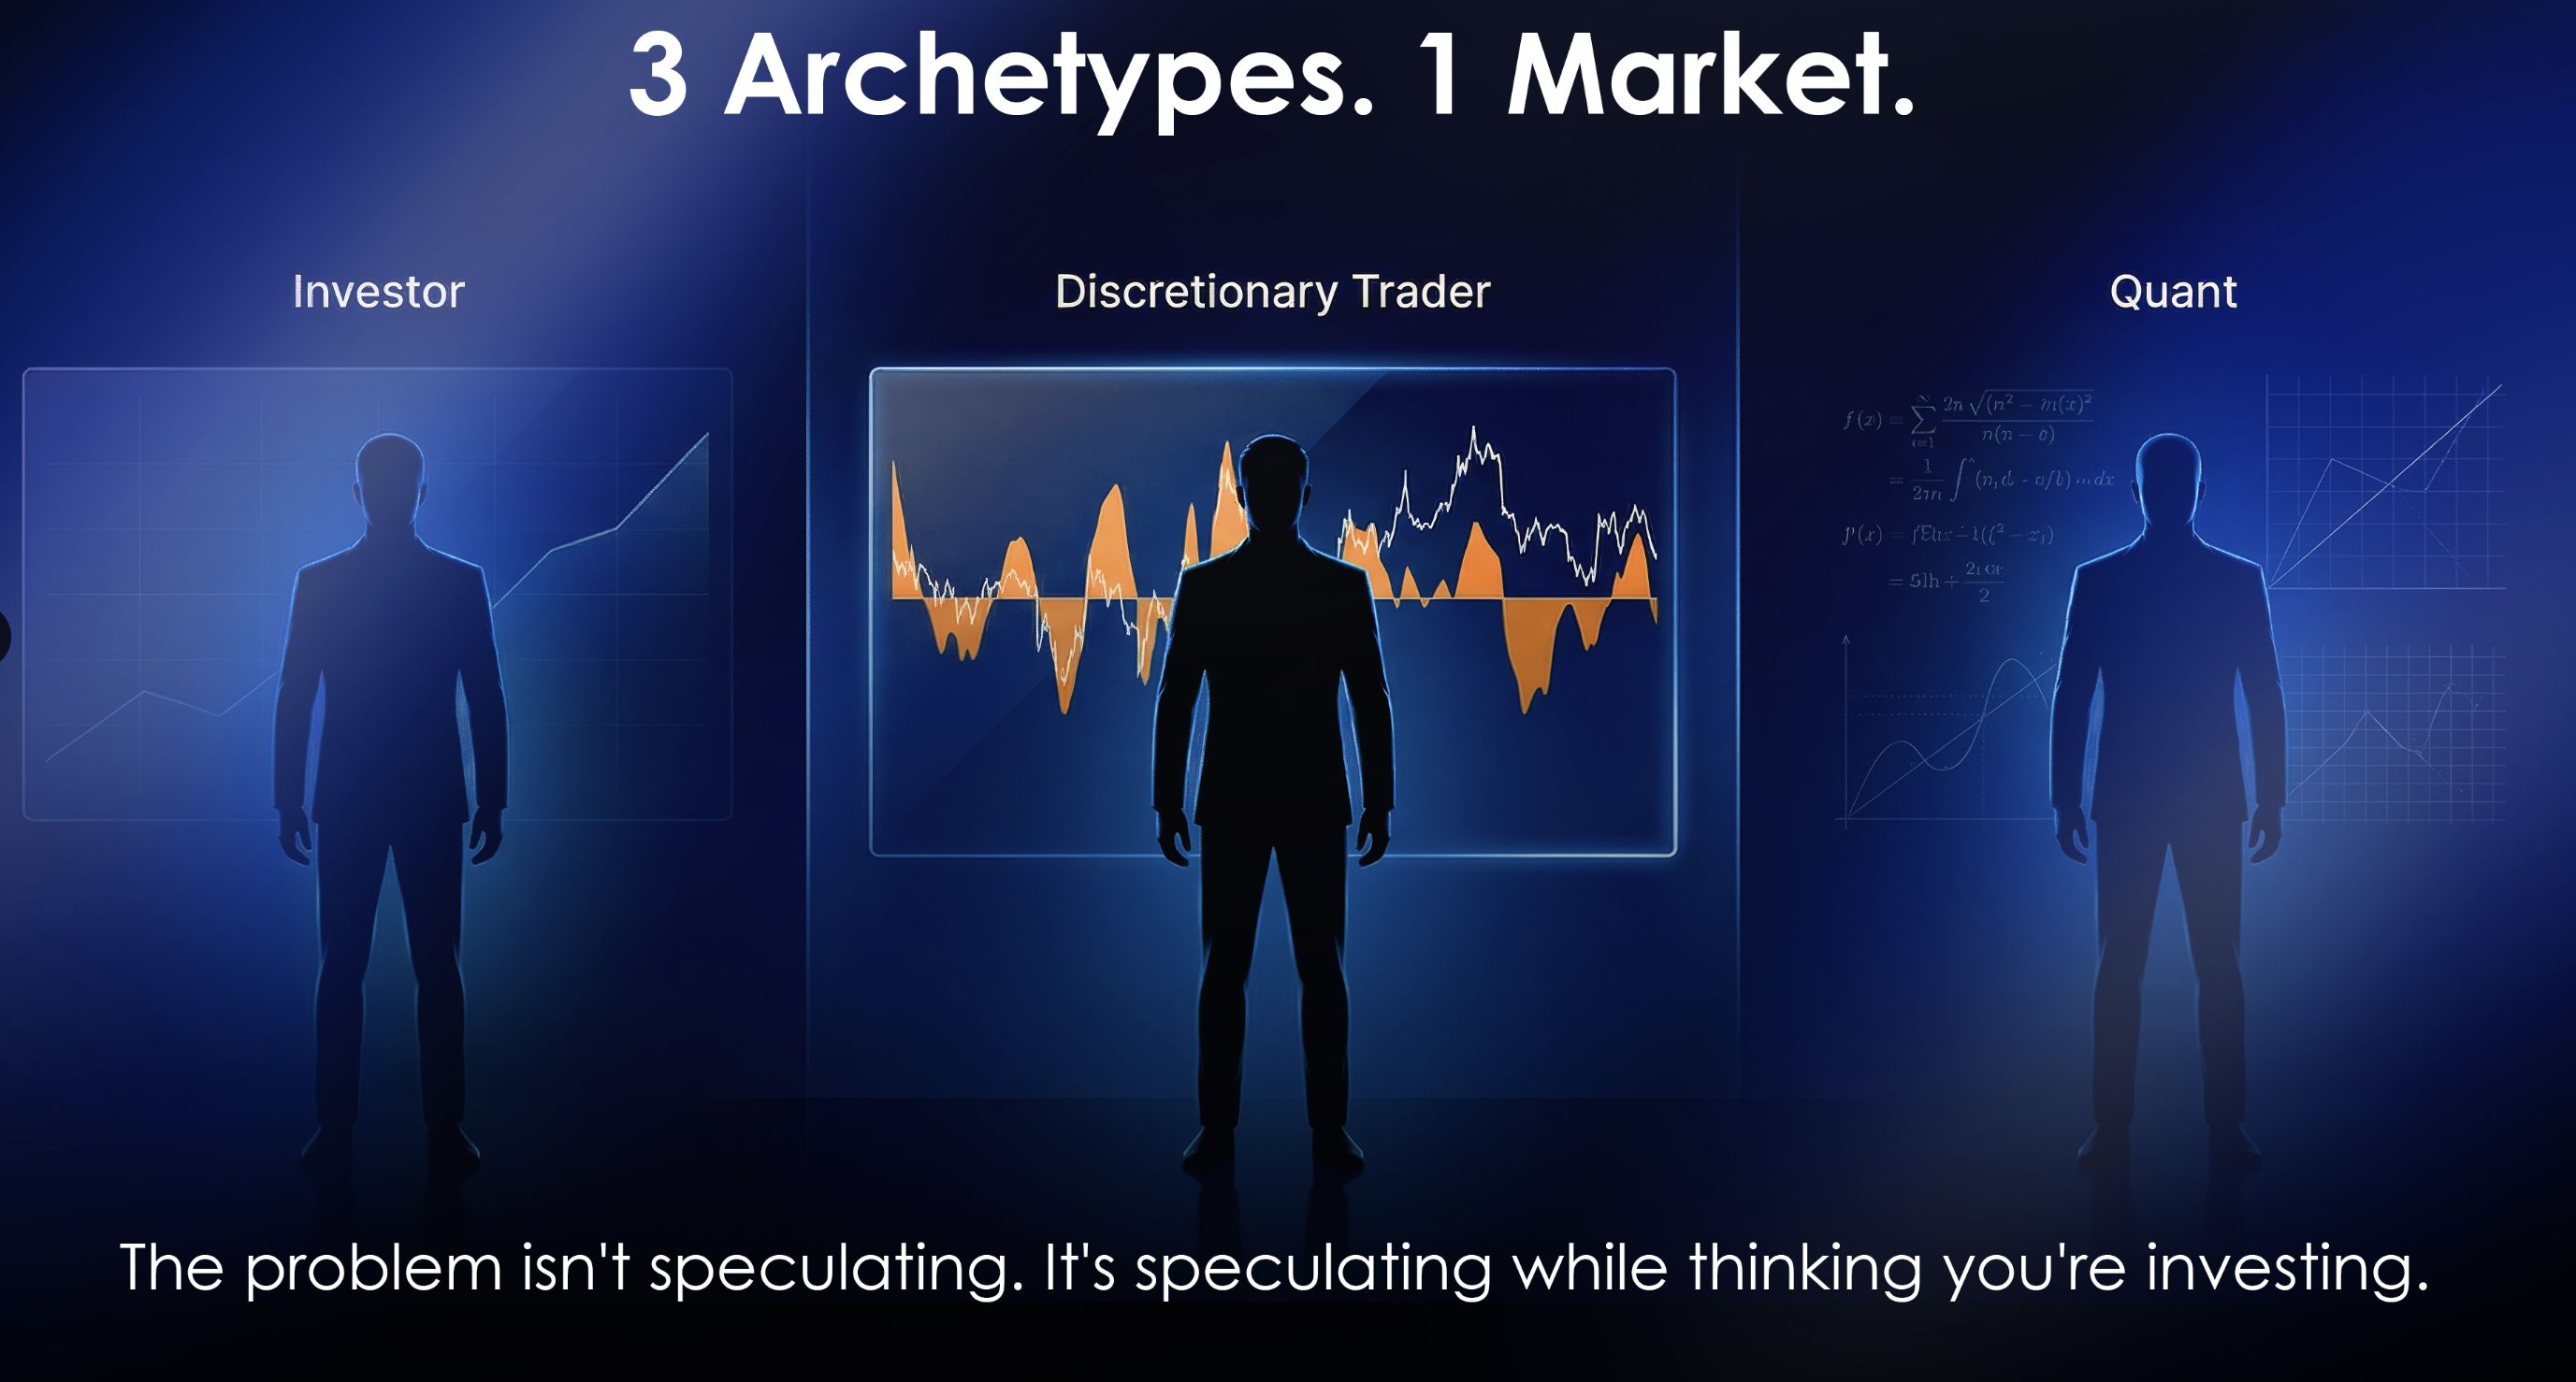
Graham's warning:
The problem isn't speculating.
It's speculating while thinking you're investing.
That confusion is the fastest route to financial ruin.
Which one are you?
2. For the long-term holder, a crypto asset is a
living organism.
The blockchain data is its vital signs.
The goal: find intrinsic value.
Ignore the daily price noise.
Three pillars of on-chain fundamental analysis:
→ Network health
Processing capacity, security, decentralization level,
distribution of coins across wallets.
A strong network maintains its technical integrity
over time.
→ Macro diagnosis
Does the global scenario favor risk assets?
Will Bitcoin's digital scarcity be demanded as
inflation protection?
Macro metrics answer that.
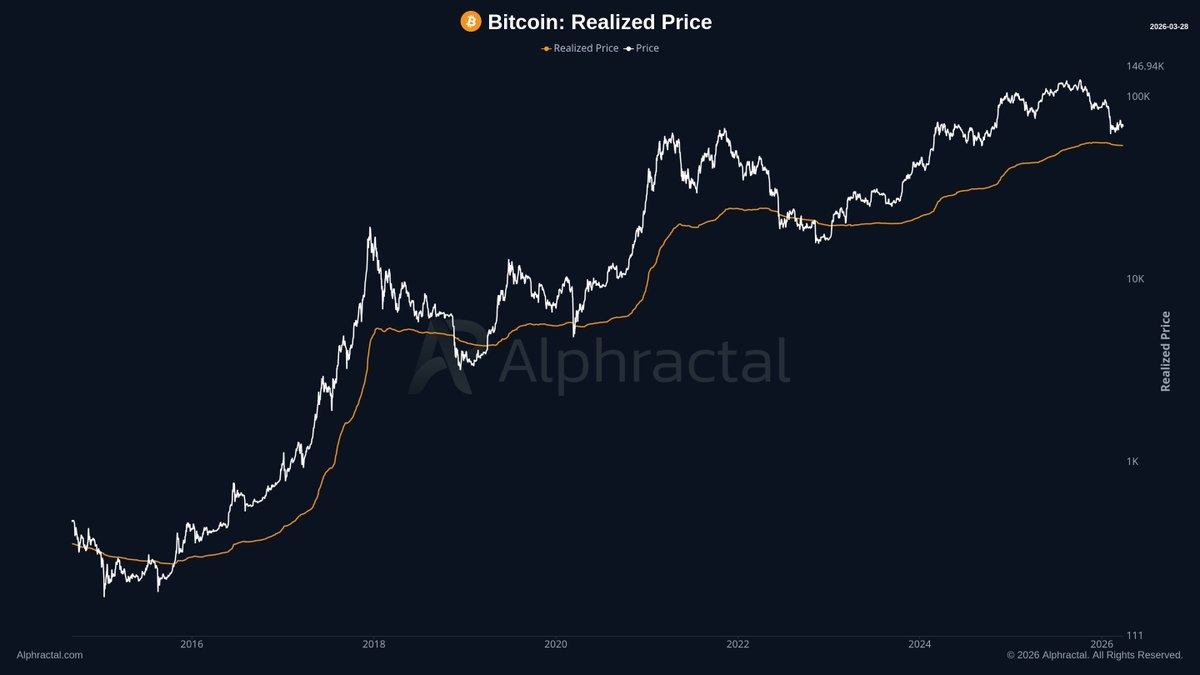
→ Fair value anchor: Realized Price
The Realized Price is not the last traded price.
It's the average value at which every Bitcoin was
last moved on-chain.
Current Realized Price: $54,210
What that tells you:
→ $54,210 is the average acquisition cost across
the entire Bitcoin network.
→ Historically, BTC trades above this line in Bull Markets.
→ When market price drops to or below $54,210, the asset
is considered underpriced, the average holder is at
breakeven or in loss.
That's your margin of safety signal.
Not a rumor. Not a tweet.
A number extracted directly from the blockchain.
3. The discretionary trader doesn't look for intrinsic value. He reads the footprints left by big players in the chart.
Three core tools:
→ Price action methodology (Wyckoff)
Identifies institutional accumulation and distribution phases.
Tracks where "smart money" is pushing the market.
→ Derivatives + sentiment data
Open Interest → measures total leveraged exposure in the market.
Fear & Greed Index → identifies whether the market is
euphoric or in panic.
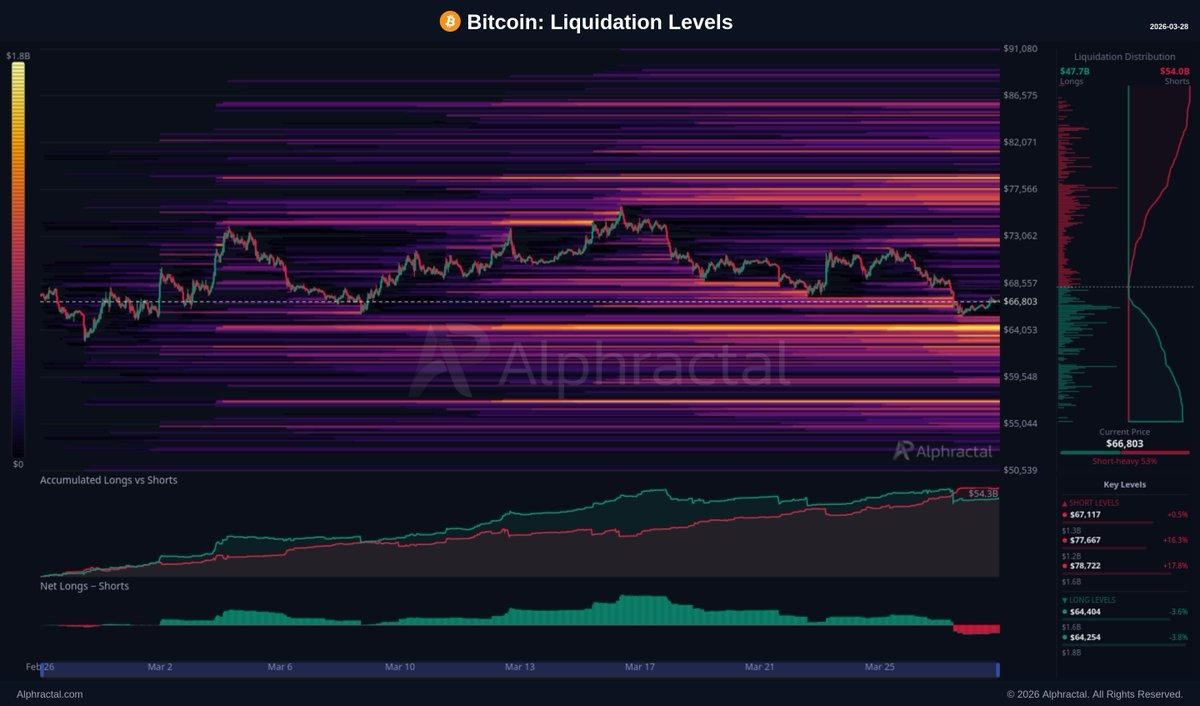
→ Liquidation Levels
The most underrated signal in crypto trading.
Here's how Liquidation Levels work:
$1.8 billion in long liquidations sitting at $64,254.
What that means:
→ A massive cluster of traders bought Bitcoin (long positions)
with their liquidation price, or stop loss, set near $64,254.
→ For whales, those $1.8B are available liquidity.
→ If price drops to $64,254, those positions are force-closed,
triggering an automatic wave of sell orders.
The move that follows:
Large players deliberately push price into those zones.
When $64,254 is hit, the cascade of forced sells allows a whale
to buy billions without moving price upward, because they're
absorbing the liquidated positions.
Price hunts liquidity before continuing any trend.
Always.
The chart doesn't lie either.
4. The third archetype removes emotion entirely.
The Quantitative Trader replaces intuition with
pure mathematics and computational power.
Three core tools:
→ On-chain: SOPR (Spent Output Profit Ratio)
Detects moments of sell exhaustion on the blockchain.
When holders stop selling at a loss, the bottom signal
emerges.
→ Derivatives: Funding Rates
Arbitrages the price difference between spot and
futures markets.
Extreme positive funding = overleveraged longs =
correction risk.
Extreme negative funding = overleveraged shorts =
squeeze risk.
→ Statistics: Z-Score
Measures how many standard deviations price sits
from its historical mean.
Identifies statistical anomalies, extreme buy or sell signals, that human discretion would miss.
Execution is fully automated.
Backtests. Algorithms. Orders in milliseconds.
No emotional bias. No hesitation.
Three archetypes. One market.
→ The Investor anchors price to on-chain fair value.
→ The Discretionary Trader reads smart money footprints.
→ The Quant runs the math no human can process in real time.
And Graham's warning applies to all three:
The problem isn't speculating.
It's speculating while thinking you're investing.
Know your archetype.
Build your framework accordingly.
At Alphractal, we build the tools for all three.
On-chain data, proprietary indicators, and cycle
readings, in one place.
This article is for information and education only and is not investment advice. Crypto assets are volatile and high risk. Do your own research.
📌 Follow @Bluechip for unfiltered crypto intelligence, feel free to bookmark & share.