$ETH Ethereum shows a repeating structure under resistance, with technical analysis pointing to a potential move lower.
Ethereum is forming a familiar pattern beneath a descending resistance line, with price action suggesting a possible repeat of prior behavior. According to Elja, this setup has appeared before - and historically, it did not lead to an upside breakout. The current structure shows recovery attempts failing below a clear ceiling, raising the risk of another downside move.
✨A Familiar ETH Pattern Under a Falling Ceiling
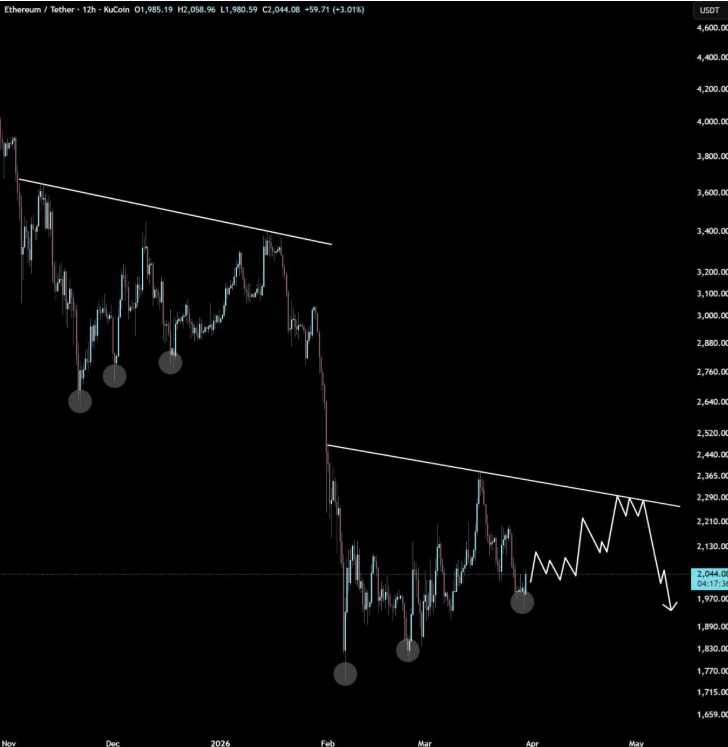
Ethereum's chart shows a consistent structure: a sharp drop followed by a choppy recovery that fails to break above a descending trendline. This creates a sequence of lower highs, keeping pressure on price.
This setup has appeared before - and each time, it resolved lower rather than breaking out to the upside.
This aligns with broader ETH technical analysis, where repeated failures under resistance often signal continuation rather than reversal.
✨ETH Recovery Attempts That Lack Follow-Through
After the initial breakdown, ETH stabilized and began forming a base with multiple reactions from local lows. However, each rally has stalled before reclaiming higher structure.
The chart reflects:
A sharp impulsive drop
Consolidation rather than trend reversal
Repeated failures below descending resistance
This behavior is consistent with markets that are correcting within a broader bearish structure rather than building a new uptrend.
Every bounce is getting sold into. The structure keeps printing lower highs - that is not how a reversal looks.
✨The Ethereum Structure Mirrors Prior Downside Continuations
The key insight is not the current move, but the repetition of structure. Ethereum has previously shown similar patterns - temporary stabilization followed by renewed downside.
Recent market analysis supports this view, noting that ETH remains under persistent resistance, with every bounce being rejected and the trend still tilted lower.
At the same time, compression patterns like this often precede expansion, with direction typically following the prior move unless resistance is reclaimed.
The market is compressing under a falling ceiling. Until that line breaks, the path of least resistance stays down.
✨A Setup Defined by One Outcome
The chart projection suggests a modest push higher into resistance, followed by rejection and continuation lower. This reflects a classic retest scenario, where price revisits resistance before resuming the trend.
The structure remains clear: unless ETH breaks above the descending trendline, the pattern favors downside continuation. Traders watching ETH's SuperTrend support levels will note that compression at this stage rarely resolves upward without a decisive structural break.
♥️♥️♥️🚀🚀🚀FOLLOW ME 🌍🌎🌏
Appreciate my work. 😍 THANK YOU ! 😘
👉👉👉If You follow me, I'll follow you back as MutualFollow 💥✨🚀🚀🚀🚀🚀
MAKE YOUR ACCOUNT GROW !!! 🌍🌎🌏